
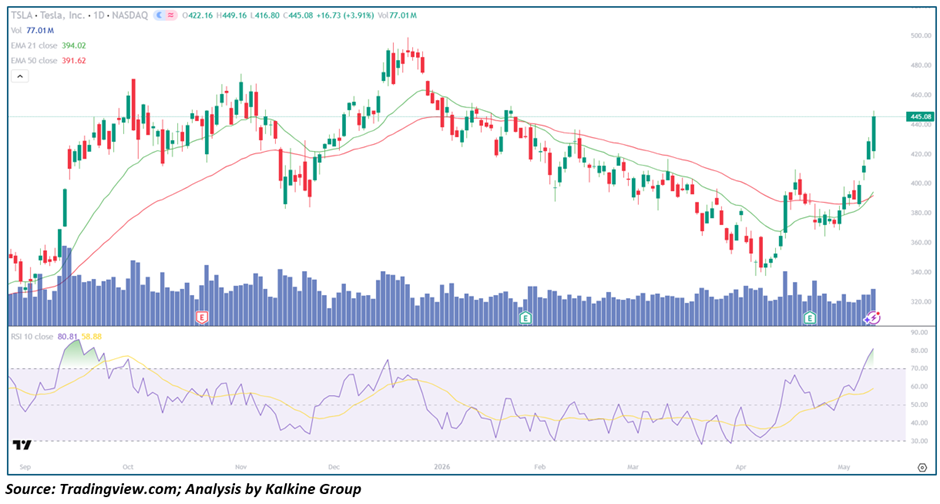
Key Highlights
- Tesla (Nasdaq: TSLA) is surging to $445.08 (+3.91%), now trading a powerful $51.06 above EMA-21 ($394.02) and $53.46 above EMA-50 ($391.62) — with both EMAs converging and curling sharply upward in a freshly confirmed golden cross alignment
- Price has broken above the critical $440–$445 resistance zone — the January 2026 consolidation highs — effectively completing a full round-trip recovery from the brutal February–April 2026 drawdown and establishing a new multi-month high
- RSI-10 at 80.81 with smoothing average at 58.88 — RSI has crossed decisively into overbought territory with a massive 22-point gap above its signal line, signaling explosive momentum but also warranting caution around short-term overextension
- Volume at 77.01M is among the highest single-session readings in the entire twelve-month chart, delivering the most powerful volume confirmation of institutional participation seen in months — a definitive signal that this is not a low-conviction retail move
- An apparent Earnings catalyst (E marker visible on today's session) appears to be driving a fundamental re-rating that is compressing months of overhead resistance in a single explosive session
Trend Structure: Dramatic V-Shaped Recovery — Bear Phase Entirely Erased in Weeks
Tesla's technical journey over the past twelve months has been one of the most volatile in the large-cap universe. The stock launched from the $330 area in September 2025, rallied to $490+ by December 2025, corrected sharply to $340 in February 2026, recovered briefly to $450, then collapsed again to the $330–$340 lows in April 2026 — printing a complex double-bottom structure that, in hindsight, represented the definitive technical floor. The recovery from those April lows has been nothing short of spectacular: in approximately three weeks, TSLA has recaptured over $110 in price, reclaimed both EMAs, confirmed a golden cross, and is now challenging the highest levels seen since the January 2026 peak. The speed and magnitude of the recovery — combined with today's massive volume confirmation — strongly suggests this is a structural trend change rather than a temporary bounce, with institutional players aggressively repositioning long following what appears to be a fundamental catalyst of significant scale.
Price Action: Explosive Breakout Above All Key Resistance — New Multi-Month High Established
Today's +3.91% surge to $445.08 is technically decisive on multiple dimensions. The breach of the $440–$445 resistance zone — which capped the January 2026 rally and represented the last major overhead Supply level before the December 2025 highs — on today's volume is the kind of breakout that forces short-sellers to cover and attracts momentum buyers simultaneously, creating a self-reinforcing buying dynamic. The intraday range from $416.80 to $449.16 shows that while there was early session Volatility, buyers dominated and the close near the highs at $445.08 indicates strong continuation intent. The candle structure over the past three weeks shows an almost unbroken sequence of higher lows and higher highs — a clean, textbook uptrend in formation — and today's breakout above the January resistance confirms the trend is now firmly pointing higher.
Moving Averages: Golden Cross with Maximum Bullish Divergence — EMAs Providing Rising Support
The EMA transformation in TSLA has been rapid and definitive. EMA-21 at $394.02 has crossed above EMA-50 at $391.62, confirming the golden cross, and the near-convergence of the two averages at virtually the same level ($394 and $391) means the golden cross is fresh, powerful, and unambiguous. Both EMAs are now curling sharply upward, transitioning from the downward-sloping configuration that defined the February–April bear phase to rising dynamic support levels. Price at $445.08 trades $51+ above both EMAs, which while representing a stretched condition in the near term, also confirms the extraordinary momentum behind this move. The $391–$394 EMA band now represents a major support zone that, on any healthy pullback, should attract aggressive buying from trend-followers and momentum traders.
Momentum Indicators: RSI at 80.81 — Overbought but Momentum Crossover Signals Continuation
RSI-10 at 80.81 with its smoothing line at 58.88 presents a nuanced but ultimately bullish momentum picture. The RSI has crossed decisively into overbought territory above 80 — historically a level that can precede short-term consolidation or a minor pullback in TSLA — but the 22-point gap between RSI and signal line is the critical detail. This magnitude of RSI-signal divergence, with RSI well above its smoothing average, has historically in TSLA coincided with the early stages of a powerful trending move rather than an imminent Reversal. The analogous RSI configuration visible in September 2025 — where RSI similarly spiked above 80 with a large signal gap — preceded a sustained multi-month advance. While near-term consolidation to allow the RSI to cool toward the 65–70 zone would be healthy and expected, the momentum structure does not currently signal a trend reversal.
Volume Analysis: Historic Institutional Participation Confirms Fundamental Re-Rating
Volume at 77.01M is one of the largest single-session readings visible across the entire twelve-month chart, and its occurrence on a +3.91% up day alongside what appears to be an earnings catalyst represents the most powerful combination of fundamental and technical confirmation available in chart analysis. The volume dwarfs the Average Daily Volume seen throughout most of 2025 and early 2026, and the earnings marker on today's session suggests that a positive fundamental surprise — whether in Revenue, delivery numbers, Margin recovery, or forward guidance — is driving a wholesale institutional reassessment of TSLA's valuation. The pattern of volume over the past three to four weeks also shows a consistent accumulation signature: above-average volume on up days, below-average volume on pullbacks — the textbook definition of institutional buying into weakness.
Key Technical Levels and Scenarios
Support Levels
- $430–$435 — Immediate support (today's breakout consolidation zone)
- $394–$400 — Critical support (EMA-21/EMA-50 golden cross zone; major pullback target)
- $375–$380 — Major support (pre-breakout base; trend invalidation warning level)
Resistance Levels
- $449–$450 — Immediate resistance (today's intraday high / psychological level)
- $470–$480 — Near-term resistance (December 2025 consolidation lows)
- $490–$495 — Major resistance (December 2025 peak highs)
Scenarios
- Bullish Continuation (Primary Case) — Golden cross confirmed, RSI above signal, historic volume on earnings catalyst — price consolidates briefly in the $430–$450 range before advancing toward $470 and $490 as momentum attracts fresh institutional positioning.
- Healthy Overbought Pullback (Secondary Case) — RSI at 80+ triggers a brief consolidation or pullback toward the $410–$420 zone on reduced volume, where buyers re-emerge and the uptrend resumes — this would represent an improved risk/reward entry for those who missed the initial move.
- Breakout Failure (Low Probability) — A daily close back below EMA-21 at $394 on elevated volume and a negative fundamental follow-through would signal the earnings gap was a false breakout — this scenario is not supported by the current weight of evidence but requires monitoring.
Conclusion: Most Powerful Bullish Session in Months — Structural Trend Change Confirmed
Tesla is delivering one of the most technically and fundamentally convincing bullish breakouts visible in the current large-cap market, with today's surge to $445.08 on 77M shares — the highest volume in months — confirming that institutional players are aggressively repositioning long following what appears to be a material positive catalyst. The golden cross EMA alignment, the breach of multi-month resistance at $440–$445, the RSI momentum crossover, and the extraordinary volume confirmation collectively present an unambiguous bull case. While the RSI at 80.81 warns of short-term overextension and a consolidation phase is likely before the next leg higher, the structural trend change from the April double-bottom lows is now fully confirmed. Near-term targets of $470–$480 and ultimately $490–$495 are technically achievable if the fundamental re-rating narrative sustains, with the $391–$394 EMA golden cross zone serving as the key support level that must hold to keep the bull case intact.


 Please wait processing your request...