
Key Highlights
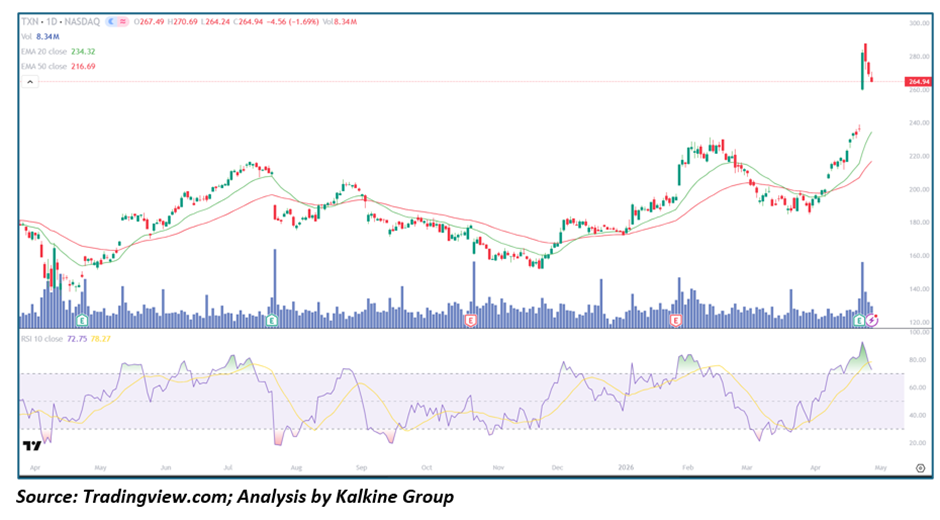
• Texas Instruments is trading well above its 20-day (~234.32) and 50-day (~206.69) moving averages, confirming a strong uptrend
• Price recently surged sharply toward the 280 zone before facing rejection and pulling back
• RSI near 72 to 78 indicates overbought conditions with early signs of cooling
• Volume spiked during the rally phase, signaling strong participation
• Structure remains bullish with higher highs and higher lows intact
Trend Structure: Strong Uptrend with Early Signs of Exhaustion
TXN remains in a well-defined bullish trend, though recent price action suggests short-term exhaustion after a sharp rally.
Key observations include:
• Consistent pattern of higher highs and higher lows
• Strong breakout followed by a sharp upward extension
• Recent pullback after a vertical move
This suggests:
• Buyers are still in control overall
• Trend remains intact but stretched
• Momentum phase may be transitioning into consolidation
The structure reflects a mature uptrend entering a cooling phase rather than a Reversal.
Price Action: Sharp Rally Followed by Rejection at Highs
Recent price behavior shows a shift from aggressive buying to profit-taking:
• Strong bullish candles during the rally phase
• Rejection near the 280 zone with upper wicks
• Mild pullback indicating Supply at higher levels
This implies:
• Momentum buyers drove the rally
• Sellers are emerging near highs
• Near-term consolidation or Retracement likely
Such action typically signals:
• Pause in trend rather than Reversal
• Market digesting recent gains
Moving Averages: Bullish Alignment Remains Intact
The Moving Average setup continues to support the uptrend:
• Price is comfortably above the 20-day MA (~234)
• Price remains well above the 50-day MA (~206)
• Both averages are trending upward
Interpretation:
• Short-term trend remains bullish
• Medium-term structure is strong
• Moving averages provide dynamic support on pullbacks
Any dip toward these levels could attract buying interest.
Momentum Indicators: Overbought but Cooling
RSI is currently elevated in the 70 plus zone, indicating strong but stretched momentum.
Key signals:
• RSI above 70 indicates overbought conditions
• Recent rollover suggests momentum cooling
• No clear bearish divergence yet
Interpretation:
• Trend strength remains intact
• Short-term pullback or sideways movement likely
• Momentum reset could support next leg higher
Volume Analysis: Rally Supported by Strong Participation
Volume trends confirm the strength of the prior move:
• Noticeable spike during the breakout phase
• Increased participation at higher levels
• No clear signs of heavy distribution yet
This indicates:
• Strong buying conviction during the rally
• Institutional activity likely present
• Pullback appears healthy rather than bearish
Market Structure: Bullish Trend with Near-Term Consolidation Risk
The broader structure supports continued upside, though near-term risks are rising:
• Uptrend remains intact
• Price extended above key moving averages
• Momentum showing signs of cooling
This combination suggests:
• Bullish bias remains
• Potential for consolidation or pullback
• Opportunity for trend continuation after reset
Key Technical Levels and Scenarios
Support Levels
• 250 as recent breakout and short-term support
• 234 as 20-day Moving Average support
• 206 to 220 as 50-day Moving Average support
Resistance Levels
• 280 as recent high and rejection zone
• 300 as psychological resistance
• 320 as next potential upside target
Scenarios
- Bullish Continuation (Primary Case)
• Price holds above 250
• RSI stabilizes and turns higher
• Volume supports renewed buying
• Move toward 280 to 300 - Healthy Pullback (Secondary Case)
• RSI cools further
• Price retraces toward 234 to 250
• Buyers step in near moving averages
• Uptrend resumes afterward - Deeper Correction (Low Probability Scenario)
• Breakdown below 250
• Increased selling pressure
• Test of 206 to 220 zone
• Trend weakens temporarily
Conclusion: Strong Uptrend with Short-Term Cooling Phase
Texas Instruments is exhibiting a strong bullish structure supported by rising moving averages and solid prior momentum. However, the recent sharp rally has pushed the stock into overbought territory, leading to a pullback from highs. While near-term consolidation or Retracement is likely, the broader trend remains intact. As long as key support levels hold, any dip could present an opportunity for continuation of the uptrend after momentum resets.


 Please wait processing your request...