
Key Highlights
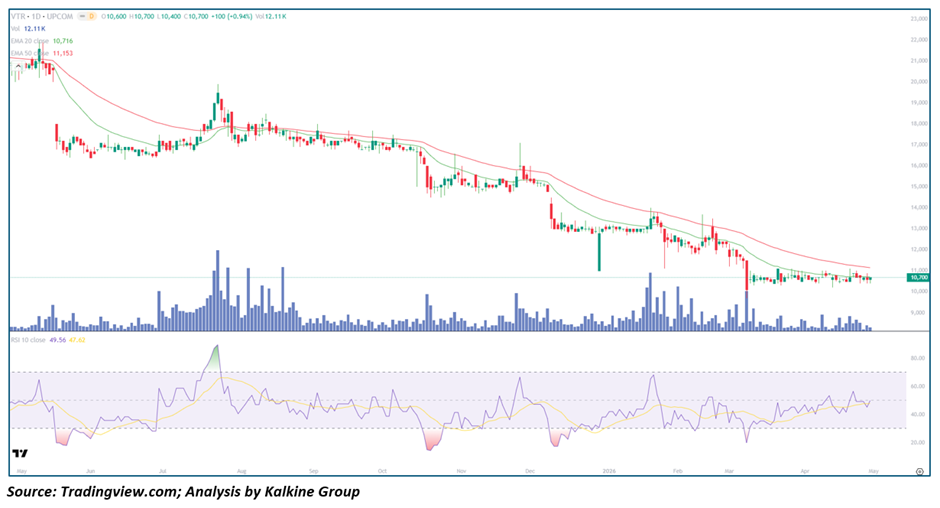
• VTR is trading below its 20-day (~10,716) and 50-day (~11,153) moving averages, confirming a sustained bearish trend
• Price has declined steadily from the 18,000–20,000 region toward the 10,500–11,000 zone
• RSI is near 50, indicating neutral momentum after prolonged weakness
• Volume has declined overall, suggesting reduced participation
• Price is attempting to stabilize near recent lows
Trend Structure: Persistent Downtrend with Early Stabilization
VTR remains in a clear bearish structure, though recent price action suggests early signs of stabilization.
Key observations include:
• Consistent pattern of lower highs and lower lows
• Strong downward slope over multiple months
• Recent flattening of price near support
This suggests:
• Sellers have been in control
• Downtrend momentum is slowing
• Early base formation may be developing
The broader trend remains bearish, but downside pressure is easing.
Price Action: Sideways Consolidation After Decline
Recent price behavior indicates consolidation:
- Price moving in a tight range near 10,500–11,000
• Reduced Volatility compared to earlier decline
• Lack of strong bullish Reversal candles
This implies:
• Selling pressure is decreasing
• Buyers are not yet aggressive
• Market is in a pause phase
Such action typically signals:
• Base-building process
• Potential setup for future breakout or breakdown
Moving Averages: Bearish Alignment Remains Intact
The Moving Average structure confirms ongoing weakness:
- Price remains below the 20-day MA (~10,716)
• Price is below the 50-day MA (~11,153)
• Both averages are sloping downward
Interpretation:
• Short-term trend is bearish
• Medium-term trend remains bearish
• Moving averages act as resistance on rallies
Momentum Indicators: Neutral After Oversold Phase
RSI is currently around the 50 level.
Key signals:
• RSI recovering from previously lower levels
• Neutral momentum with no strong directional bias
• Lack of bullish divergence confirmation
Interpretation:
• Selling pressure has eased
• Momentum is stabilizing
• No strong trend signal yet
Volume Analysis: Declining Participation
Volume trends show reduced activity:
- Lower Volume during consolidation phase
• No strong accumulation signals
• Occasional spikes without follow-through
This indicates:
• Lack of strong conviction
• Market indecision
• Waiting for a catalyst
Market Structure: Bearish with Base Formation Attempt
The broader structure remains weak but evolving:
- Long-term downtrend intact
• Price consolidating near lows
• Early signs of potential base formation
This combination suggests:
• Breakdown risk still present
• Recovery requires confirmation
• Market is at an inflection point
Key Technical Levels and Scenarios
Support Levels
• 10,500 as immediate support
• 10,000 as psychological support
• 9,000 as major downside level
Resistance Levels
• 10,700–10,800 near 20-day MA
• 11,100–11,200 near 50-day MA
• 12,000 as key recovery resistance
Scenarios
- Base Formation & Recovery (Primary Case)
• Price holds above 10,500
• RSI stabilizes above 50
• Gradual move toward 11,200–12,000 - Continued Consolidation (Secondary Case)
• Price remains range-bound
• Low Volatility persists
• No strong directional move - Bearish Breakdown (Risk Scenario)
• Price breaks below 10,500
• Volume expands on selling
• Move toward 9,500–10,000
Conclusion: Weak Trend with Stabilization Signals Emerging
VTR remains in a broader downtrend, but recent price action suggests a slowdown in bearish momentum and the early stages of a base formation. While the stock is not yet showing a confirmed Reversal, holding current support levels could lead to gradual recovery. A decisive breakout above key moving averages is needed to shift the outlook from bearish to bullish.


 Please wait processing your request...