
Key Highlights
- Chevron Corporation has pulled back sharply after a strong multi-month uptrend
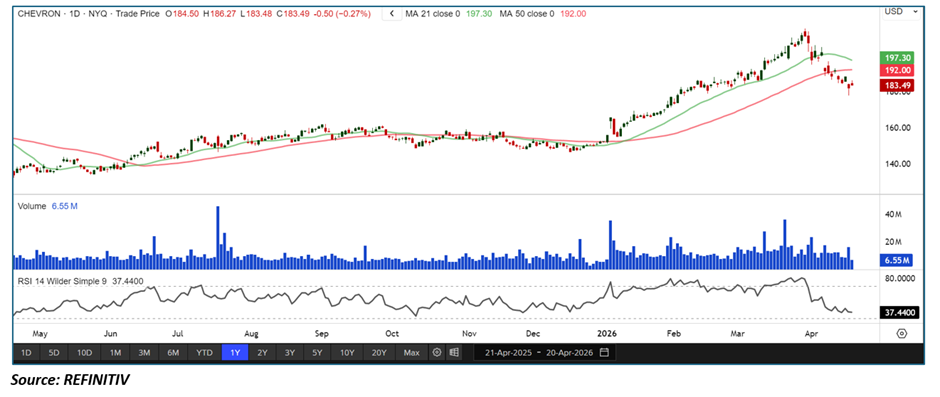
• Price has broken below both the 21-period and 50-period SMAs, signaling a loss of short-term trend strength
• Selling pressure has increased following a failed attempt to sustain highs near the recent peak
• RSI has dropped into neutral-to-weak territory (~37), indicating fading momentum
• Volume remains steady but shows distribution characteristics during the decline
Trend Structure: From Strong Uptrend to Corrective Phase
CVX is transitioning from a well-established uptrend into a short-term corrective structure.
Key observations include:
• Strong rally from prior lows followed by a sharp reversal
• Failure to hold above recent highs, signaling exhaustion
• Early signs of trend transition from bullish to neutral/bearish
This suggests the stock may be entering a cooling phase after an extended upside move.
rice Action: Rejection From Recent Highs
Recent price behavior reflects clear distribution at elevated levels:
- Sharp rejection from peak resistance zone
• Lower highs forming after the top
• Accelerated downside momentum over recent sessions
This shift implies:
• Buyers are losing control at higher levels
• Profit-taking has intensified
• Short-term trend structure has weakened significantly
Moving Averages: Breakdown Below 21 & 50 SMA
The moving average structure has turned negative in the short term:
- Price has fallen below the 21-period SMA (early weakness signal)
• Price has also broken below the 50-period SMA (trend deterioration)
• Both averages may now act as overhead resistance
When price trades below both:
• It often confirms a shift from bullish to corrective bias
• Rallies tend to face selling pressure at moving averages
omentum Indicators: RSI Cooling from Overbought Conditions
RSI is reflecting clear momentum deterioration:
- RSI has dropped to ~37, near weak-neutral territory
• Momentum has shifted from strong bullish to corrective
• No immediate bullish divergence visible
Interpretation:
• Previous uptrend momentum has fully cooled
• Stock is no longer in a momentum-driven phase
• Further consolidation or downside risk remains present
Volume Analysis: Distribution Signals Emerging
Volume behavior suggests active repositioning:
- Elevated volume during the selloff phases
• Consistent participation on down days
• Lack of strong accumulation during rebounds
This indicates:
• Institutional profit-taking may be occurring
• Short-term supply is outweighing demand
• Market is in a redistribution phase rather than accumulation
Market Structure: Short-Term Correction Within Broader Trend
Despite recent weakness, the broader structure remains mixed:
- Prior uptrend was strong and sustained
• Current pullback appears corrective rather than structural collapse
• Market is testing whether a higher low will form
This combination often signals:
• Mid-cycle consolidation within a broader energy trend
• Potential reset before next directional move
Key Technical Levels & Scenarios
Support Levels
- $180–185 zone (near-term demand area)
• Prior consolidation base
• Psychological round-number support
Resistance Levels
- 21-period SMA (~197)
• 50-period SMA (~192)
• Recent swing high zone (~210+)
Scenarios
- Bullish Recovery (Rebound Case)
- Price holds above $180 support zone
• RSI stabilizes and recovers above 45–50
• Reclaim of 50 SMA confirms stabilization
• Gradual move back toward prior highs
- Continued Consolidation (Base Case)
- Price fluctuates between $180–$192 range
• RSI remains in neutral zone
• Market builds new base after correction
• Volatility compresses before next move
- Bearish Extension (Risk Case)
- Breakdown below $180 support
• Continued rejection below 50 SMA
• RSI weakens below 30–35
• Deeper corrective phase develops
Conclusion: Short-Term Weakness After Strong Uptrend, But Broader Structure Still Intact
Chevron Corporation is currently undergoing a short-term corrective phase after a strong multi-month rally. The breakdown below both the 21 and 50 SMAs, combined with weakening RSI and distribution-style volume, suggests momentum has shifted in favor of sellers in the near term.
However, given the broader uptrend that preceded this move, the current pullback still appears corrective rather than structural. The key level to watch is the $180 support zone, which will determine whether CVX stabilizes for another leg higher or extends its correction.
As long as Chevron holds above major support levels, the broader bullish energy-sector structure remains intact despite short-term weakness.


 Please wait processing your request...