
 CA
 NZ
 UK
 AU
 IND

 US

 Share
 X (Formerly Twitter)
 Whatsapp
 Facebook
 LinkedIn
 Telegram
 Email This Article
 Copy Link
 Summarize with AI
 Chat GPT
 Perplexity

Dell Technologies Inc. (NYSE: DELL) is holding near the top of its 2026 range after a sharp intraday reversal. As of this chart snapshot (about 1 hour 47 minutes before the close), shares are trading at $574.39, down $2.37 (-0.41%). The stock gapped down from Monday’s close near $576.76 to open at $556.62, fell to an intraday low of $548.40, just under the 21-day EMA, then rallied to a high of $579.74 and filled the gap. The long lower wick shows buyers defending the average, and price sits about 3.5% below the September and October highs near $595. I could not find a company-specific catalyst, so the case rests on the chart. 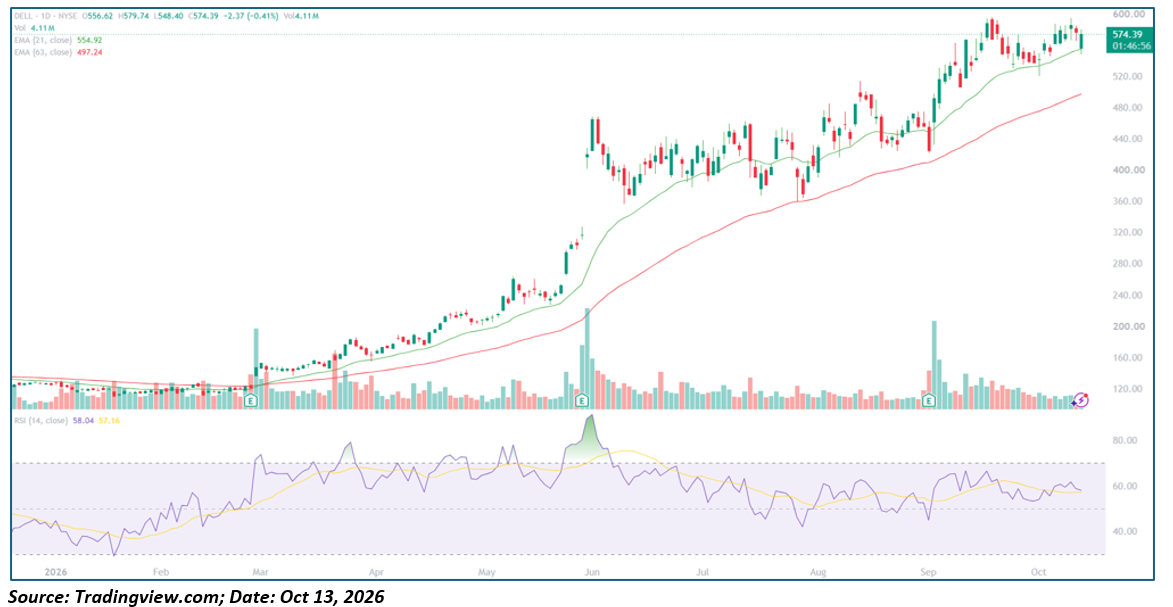
Key Highlights
- Trading at $574.39, down $2.37 (-0.41%), on partial-session Volume of 4.11M shares
- Opened at $556.62 (gap down), low of $548.40, high of $579.74
- 21-day EMA at $554.92 and 63-day EMA at $497.24, both below price
- 14-day RSI at 58.04, just above its 57.16 signal line
- Resistance at $579.74, about $595 and $600; support at $556.62, $554.92 and $548.40
Trend Structure: Three-Act Pattern
- Base and Breakout (January – April 2026): DELL ranged near $120 to $135 through January and February, with RSI falling to about 28 in late January. A heavy-volume gap up around the early-March Earnings report lifted price to about $150. The stock then climbed steadily to about $185 in late March and about $220 by late April.
- Parabolic Run and Earnings Gap (May – June 2026): The advance accelerated to about $260 in mid-May and about $330 by late May. A gap up around the early-June earnings report, on the largest volume of the year, took price to about $465, with RSI near 95, an extreme overbought reading. A pullback to about $355 followed within days.
- Range, Breakout and Consolidation (June – October 2026): DELL ranged between roughly $360 and $460 through June and July, holding the 63-day EMA on dips to about $365 in mid-July and about $360 in late July. It pushed to about $515 in mid-August and dipped to about $420 by the end of the month. A heavy-volume gap up around the early-September earnings report started a run to about $595 in mid-September. The stock has since ranged between about $520 and $595, with a second peak near $595 in early October. Price is now up about 4.5 times from the January low.
Backdrop
The chart marks earnings in early March, early June and early September, and each report was followed by a large gap up on heavy volume. The June and September gaps produced the biggest volume spikes of the year. The next report is typically due in late November, so confirm the date. It is likely the next large catalyst, and until then price and the moving averages drive the setup.
Moving Averages and Momentum Profile
- Gap Dynamics: The stock opened at $556.62, well below Monday’s close near $576.76, and recovered the whole gap by trading up to $579.74. The dip to $548.40 undercut the 21-day EMA and reversed, which leaves a long lower wick that shows dip buying. The recovery has not yet pushed price past the $595 peak.
- Moving Average Stack: The 21-day EMA ($554.92) is above the 63-day EMA ($497.24), and both are rising. Price is about 3.5% above the 21-day and 15.5% above the 63-day, so the 21-day is very close support and the 63-day is far below.
- Oscillator Behavior: RSI at 58.04 is just above its signal line and well below the 70 overbought line. It has stayed between about 50 and 67 since June, so momentum has cooled from the extreme June reading without breaking down. That leaves room to rise if price pushes out of the range.
- Volume Behavior: Volume of 4.11M is partial, with the session still open. It is quiet compared with the earnings-day surges, so a break above $595 would need above-average volume to carry weight.
Key Technical Levels
|
Level |
Type |
Note |
|
$600 |
Resistance |
Round-number chart ceiling |
|
~$595 |
Resistance |
Mid-September and early-October swing highs (approximate) |
|
$579.74 |
Resistance |
Today’s intraday high |
|
$576.76 |
Reference |
Monday’s close, top of today’s gap down (filled) |
|
$574.39 |
Reference |
Current price |
|
$556.62 |
Support |
Today’s open, bottom of the gap |
|
$554.92 |
Support |
21-day EMA |
|
$548.40 |
Support |
Today’s low |
|
~$520 |
Support |
Early-October pullback low (approximate) |
|
$497.24 |
Support |
63-day EMA |
|
~$420 |
Support |
Late-August swing low (approximate) |
Actionable Technical Outlook
- A close above about $595 would be a new 2026 high and break the range that has held since mid-September, with $600 as the first round-number target.
- Near-term structure stays constructive while the stock holds above the 21-day EMA ($554.92). A close below it would point to $548 and about $520, with the 63-day EMA near $497 as the next reference.
- This is the third approach to the $595 area since mid-September, so a stall and retest of $555 to $576 is possible before any breakout. This is a technical read, not Investment advice.
Metadata
|
Field |
Value |
|
Headline |
Why did Dell Technologies (NYSE: DELL) recover from a gap down to $574.39 off its 21-day EMA, and can it clear $595? |
|
SEO title |
Dell (DELL) Near 52-Week High: 21-Day EMA and $595 Level |
|
Meta description |
Dell Technologies (NYSE: DELL) recovers from a gap down to $574.39 off its 21-day EMA near its 52-week high. RSI 58, key support and resistance levels for traders. |
|
Slug |
why-dell-technologies-dell-nyse-stock-near-52-week-high-21-day-ema-595-level |
|
Tags |
Dell Technologies, DELL, NYSE, computer hardware, technical analysis, moving averages, 52-week high |
|
Ticker / Sector |
DELL / Information Technology |
|
Verification status |
PARTIAL (levels read from the chart; 52-week high and catalyst not confirmed) |
|
Data as-of date |
October 13, 2026 (intraday; chart snapshot about 1 hour 47 minutes before the US close) |


 Nov 17, 2026





 Please wait processing your request...