
Key Highlights
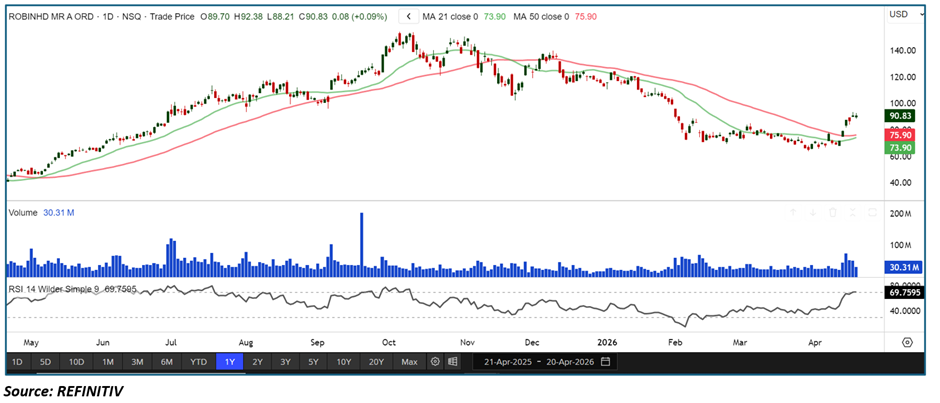
- Robinhood Markets (NASDAQ: HOOD) has shown resilience after a prolonged downtrend from late 2025 highs
• Price has reclaimed both the 21-period and 50-period SMAs, indicating improving trend structure
• A strong bounce from recent lows suggests potential bottom formation
• RSI is approaching overbought territory, reflecting strong momentum with near-term caution
• Volume remains stable, supporting the credibility of the recovery move
Trend Structure: From Correction to Recovery Phase
HOOD appears to be transitioning from a prolonged correction into an early recovery phase.
Key observations include:
• Clear stabilization after a multi-month downtrend
• Strong reaction from the ~$60–$70 zone
• Emerging signs of base formation
This suggests the stock may have established a near-term bottom, with buyers stepping in at discounted levels.
Price Action: Evidence of Bottom Formation
Recent price behavior reflects improving sentiment:
• Sharp rebound following capitulation-style selling in early 2026
• Formation of higher lows in recent sessions
• Gradual reclaim of prior breakdown zones
This shift implies:
• Selling pressure has been absorbed
• Demand is returning at lower levels
• Increasing probability of a sustained recovery phase
Moving Averages: Reclaim of 21 & 50 SMA Signals Strength
The moving average structure is turning constructive:
• Price has moved above the 21-period SMA (~$73.90)
• Price has also reclaimed the 50-period SMA (~$75.90)
• Both averages are beginning to flatten, reducing bearish pressure
When price holds above these levels:
• It signals a shift toward a neutral-to-bullish bias
• Pullbacks often find support near these dynamic levels
Momentum Indicators: RSI Approaching Overbought Territory
RSI is signaling strong momentum with some caution:
• RSI is near 70, approaching overbought levels
• Reflects strong recent buying pressure
• No clear bearish divergence yet
Interpretation:
• Momentum is strong and supportive of upside
• However, short-term consolidation or minor pullback is possible
Volume Analysis: Stable Participation Supports Recovery
Volume trends provide confirmation:
• Consistent participation during the rebound
• No signs of weak or fading interest
• Supports the validity of the recovery
While not explosive, steady volume suggests accumulation rather than a temporary bounce.
Market Structure: Early Signs of Bottoming Out
The broader structure indicates a bottoming process:
• Strong bounce from lows
• Reclaim of key moving averages
• Improving momentum profile
This combination typically signals:
• Weakening bearish structure
• Transition toward accumulation
• Potential early-stage recovery trend
Key Technical Levels & Scenarios
Support Levels
- $75 zone (near-term support)
• 21-period SMA (~$73.90)
• 50-period SMA (~$75.90, now key support zone)
Resistance Levels
- $95–$100 zone (recent highs)
• $120+ (major overhead resistance from prior breakdown)
Scenarios
- Bullish Continuation (Primary Case)
• Price holds above $75
• Sustains above 21 & 50 SMA
• Gradual move toward $95–$100
• Continuation of recovery trend - Healthy Consolidation (Secondary Case)
• RSI cools from near-overbought levels
• Sideways movement or mild pullback
• Support holds near moving averages
• Base builds for next upward leg - Bearish Reversal (Invalidation Scenario)
• Price drops below $73
• Break below 50 SMA
• RSI falls below 50
• Recovery structure weakens
Conclusion: Recovery Strength with Short-Term Caution
Robinhood Markets is showing clear signs of resilience after an extended decline, with price reclaiming key moving averages and attracting buyers at lower levels.
While RSI nearing overbought levels suggests the possibility of short-term consolidation, the overall structure points toward a potential bottom already being in place.
As long as HOOD holds above the $73–$75 zone and maintains support at the 21 and 50 SMAs, the outlook favors continued recovery with scope for further upside.


 Please wait processing your request...