
Key Highlights
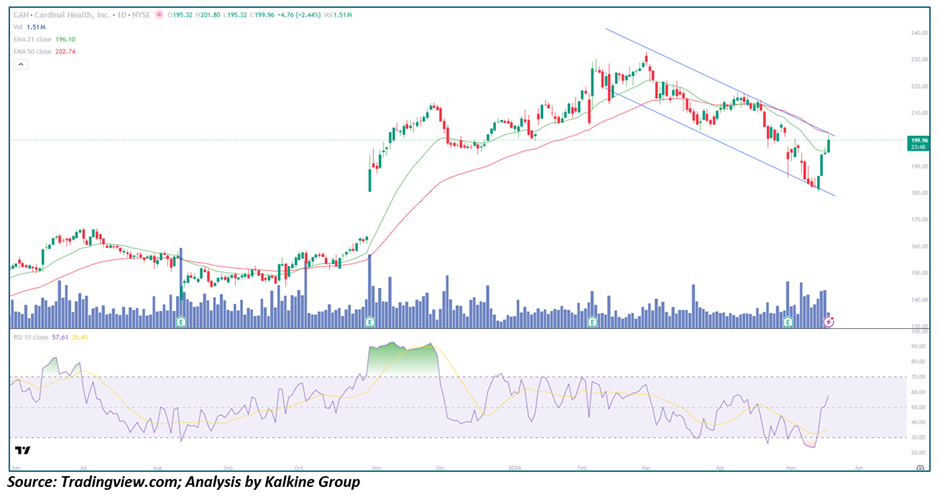
- Cardinal Health is trading near $199.96, up +2.44% after a sharp rebound from recent lows
• Price is attempting to break out of a well-defined falling channel, signaling a potential trend shift
• EMA-21 (~$196.10) has been reclaimed, while EMA-50 (~$202.74) now acts as immediate resistance
• RSI-10 at ~57.6 shows improving momentum after recovering from oversold levels
• Volume (~1.51M) has picked up on the bounce, suggesting renewed buying interest
Trend Structure: Downtrend Meets Potential Breakout
Cardinal Health has been trading in a clear descending channel since peaking near $230 earlier this year, with a consistent pattern of lower highs and lower lows defining the corrective phase. The recent selloff pushed the stock toward the lower boundary of this channel near the $180 zone, where buyers stepped in aggressively.
The latest price action shows a strong rebound off channel support, with price now testing the upper boundary of the falling channel. This is a critical inflection point — a confirmed breakout above this Trendline would mark the first structural shift from bearish to neutral, and potentially to bullish if follow-through buying emerges.
Moving Averages: Early Signs of Structural Improvement
The Moving Average setup is beginning to improve:
• EMA-21 (~$196.10) — reclaimed; now acting as short-term support
• EMA-50 (~$202.74) — overhead resistance; key breakout trigger
The reclaim of the EMA-21 is an early bullish signal, especially after a prolonged period of trading below it. However, the EMA-50 remains the more important level — a decisive move above $202–$205 would confirm a stronger trend Reversal and open the door for further upside.
Momentum & Volume: Buyers Regaining Control
Momentum indicators support the recovery narrative:
• RSI has rebounded to ~57, indicating a shift from bearish to neutral-bullish momentum
• RSI trend is upward, suggesting building strength
• MACD (visually) is flattening, hinting at a potential bullish crossover
Volume has also expanded on the recent bounce, which is a key confirmation signal. This suggests that the move is not just a weak technical bounce, but may have participation from larger market players.
Key Technical Levels and Scenarios
Resistance Levels
• $202–$205 — EMA-50 and channel breakout zone
• $210–$215 — prior lower high region
• $220+ — major resistance from earlier trend structure
Support Levels
• $195–$196 — EMA-21 support
• $185–$180 — recent swing low / channel base
Scenarios
- Bullish Breakout (Primary Case) — Price breaks above $205, confirms channel breakout, and moves toward $210–$215 as momentum builds.
- Consolidation (Secondary Case) — Stock ranges between $195–$205 while building strength for a larger move.
- Rejection (Risk Case) — Failure at EMA-50 leads to a pullback toward $185–$190, keeping the broader downtrend intact.
Conclusion: Critical Breakout Test in Progress
Cardinal Health is at a key technical juncture, transitioning from a structured downtrend into a potential reversal phase. The rebound from channel support, reclaim of the EMA-21, and improving momentum indicators all point toward strengthening bullish conditions.
However, confirmation is still needed. A decisive breakout above the EMA-50 and the falling channel resistance will be the key trigger that shifts the broader narrative from recovery to sustained uptrend. Until then, the setup favors cautious optimism, with bulls gaining traction but not yet fully in control.


 Please wait processing your request...