
Key Highlights
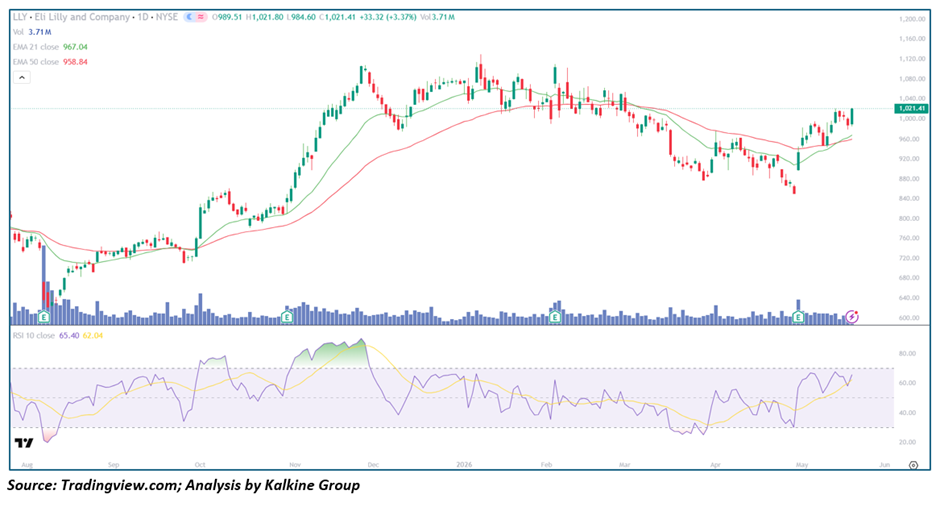
- Eli Lilly (LLY) is trading near $1,021.41, up 3.37% on the session, reclaiming the psychologically significant $1,000 level after a deep multi-month correction
- Price has pushed back above both EMA-21 (~$967.04) and EMA-50 (~$958.84), a technically significant bullish development after weeks of trading below them
- RSI-10 at 65.40 is rising strongly and has crossed above the signal line at 62.04 — momentum is firmly pointed higher
- The stock has recovered approximately 18% from its March lows near $860, erasing a significant portion of the post-December selloff
- Volume at 3.71M is elevated, suggesting institutional participation in the recovery rather than a low-conviction bounce
Trend Structure: Deep Correction Gives Way to a Meaningful Recovery
Eli Lilly's chart over the past year tells a story of extraordinary highs, a painful correction, and now a recovery that is beginning to look credible. The stock surged from roughly $720 in early October 2025 to an all-time high near $1,140–$1,160 by late November and early December — a rally of nearly 60% in under two months, powered by continued momentum around its GLP-1 weight loss and diabetes drug Franchise.
What followed was one of the more significant corrections in the stock's recent history. From the December peak, LLY sold off consistently through January, February, and into March 2026, ultimately bottoming near $860 — a drawdown of approximately 25% from the highs. Throughout this decline, both EMAs turned from support to resistance, and the stock spent weeks unable to reclaim either level despite multiple attempts.
The price action of the past several weeks marks a clear change in character. From the March lows, the stock has staged a steady, methodical recovery — not a single sharp bounce but a series of higher lows and higher highs that has now culminated in a decisive reclaim of both moving averages and the $1,000 level in the same session. That combination carries technical weight.
RSI Setup: Momentum Has Turned — And It Is Building
The RSI picture on LLY is one of the more constructive setups visible on the chart right now. After spending much of February and March oscillating in the 30–50 range — and briefly touching near 25 at the deepest point of the selloff in late March — the RSI-10 has now climbed to 65.40 and is trending sharply higher.
Critically, the RSI line has crossed above its signal line (62.04), a momentum confirmation that has historically preceded further near-term upside on this chart. Looking at prior instances where RSI made this kind of cross from a low base — October 2025 before the big rally, and briefly in January 2026 — the subsequent price action was meaningfully positive in both cases.
At 65.40, RSI is not yet in overbought territory. There is a reasonable runway before the 70–75 zone that would signal caution. The current reading suggests the recovery has legs, but is not yet overextended.
Moving Averages: A Bullish Reclaim After Weeks of Resistance
The Moving Average structure has just experienced a significant shift:
- EMA-21 (~$967.04) — price has broken cleanly above this level, which spent several weeks capping rallies. The EMA-21 is beginning to curl upward, reflecting the improving near-term momentum
- EMA-50 (~$958.84) — also reclaimed in today's session. Both EMAs are now clustered tightly around $958–$967, and price trading $54 above them is the first time since the December peak that the stock has achieved this configuration
Notably, the two EMAs are very close together — almost converging — which often signals that the trend is at an inflection point. When price breaks above two closely clustered EMAs with volume and RSI momentum, it frequently marks the beginning of a new trending phase rather than just a short-term bounce. The next few sessions will be telling: if price can hold above $1,000 on any pullback, the reclaim becomes structurally confirmed.
Volume: Institutional Fingerprints on the Recovery
Volume at 3.71M shares is notably elevated compared to the baseline of recent sessions. The prior session with comparable volume was in late March around the lows — a classic accumulation signal where high volume coincided with price finding a floor rather than continuing lower.
Today's high-volume move on a 3.37% up day through two major moving averages and a round number is exactly the kind of session that technical traders interpret as confirmation. It is difficult to generate this kind of volume and price action without significant institutional buying. The character of the volume — coming on a strong up day after a sustained recovery — is meaningfully different from the distribution volume seen during the December-to-March decline.
Key Technical Levels and Scenarios
Resistance Levels
- $1,040–$1,050 — prior consolidation zone from January and the next meaningful ceiling
- $1,080–$1,100 — cluster of highs from the January distribution phase
- $1,140–$1,160 — all-time high zone and ultimate bull target
Support Levels
- $1,000 — key psychological level; must hold on any pullback to confirm the breakout
- $967 — EMA-21 and first dynamic support
- $958 — EMA-50 and secondary dynamic support
- $920–$930 — prior resistance turned support from the recovery base
Scenarios
- Bullish Continuation (Primary Case) — Price holds above $1,000 on any short-term pullback, both EMAs begin rising in tandem, and LLY pushes toward the $1,040–$1,080 resistance zone over the coming sessions. A close above $1,050 would signal the next leg of recovery is underway and bring the all-time highs back into play.
- Consolidation Around $1,000 (Secondary Case) — The stock digests today's strong move, oscillating between $980–$1,040 while the EMAs catch up. This would be a healthy and constructive outcome — a high base from which the next breakout attempt can be launched with better risk/reward.
- Failed Breakout (Risk Case) — Price fails to hold above $1,000, slips back below the EMAs, and the recovery attempt stalls. This would likely require a broader market deterioration or a specific negative catalyst for LLY. In this scenario, the $920–$930 zone becomes the key support to watch and the correction low near $860 could be retested.
Conclusion: The $1,000 Reclaim Is a Meaningful Technical Event — Recovery Mode Engaged
Eli Lilly's chart has just produced one of its more significant sessions in months. Reclaiming both moving averages, breaking above $1,000, doing so on elevated volume with rising RSI — each of these individually would be constructive. Together in a single session, they represent a clear technical shift from recovery to potential trend resumption.
The deep correction from December's highs appears to have run its course. The March lows near $860 are now well behind, and the stock is rebuilding the technical foundation needed to challenge the $1,100–$1,160 range that marked the prior peak.
The key test is simple: can LLY hold $1,000? If yes, the next target is $1,040–$1,050. If the $1,000 level is defended on pullbacks and the EMAs continue rising, Eli Lilly sets up as one of the cleaner recovery-to-breakout charts in the large-cap space heading into the second half of 2026.


 Please wait processing your request...