
 CA
 NZ
 UK
 AU
 IND

 US

 Share
 X (Formerly Twitter)
 Whatsapp
 Facebook
 LinkedIn
 Telegram
 Email This Article
 Copy Link
 Summarize with AI
 Chat GPT
 Perplexity

Key Takeaways
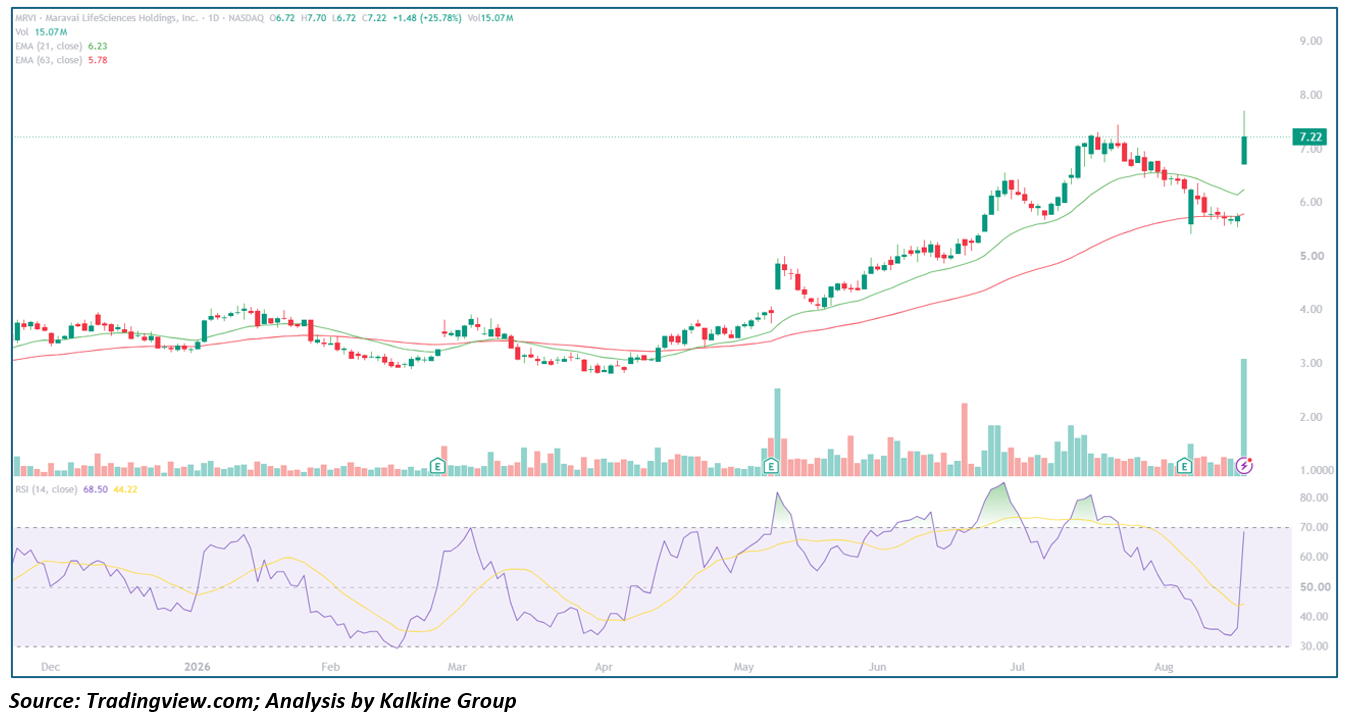
- Maravai LifeSciences rallied 25.78% (+$1.48) on Thursday to close at $7.22, Gapping up from an open of $6.72 and touching an intraday high of $7.70, the stock's largest single-day advance visible on the chart.
- The move came on Volume of 15.07 million shares, by far the heaviest single-day turnover seen across the entire chart history, dwarfing even the prior volume spikes tied to Earnings events.
- The rally reverses a corrective pullback that had pulled the stock down from a July peak near $7.00 to roughly $5.60–$5.80 by mid-August.
- Price has now reclaimed both the 21-day EMA ($6.23) and 63-day EMA ($5.78), which had been acting as resistance during the preceding decline.
- The 14-day RSI leapt to 68.50 from a prior signal-line reading of just 44.22 — a sharp, single-session momentum Reversal from a level that was approaching oversold territory.
Company and Sector Context
Maravai LifeSciences Holdings is a life sciences company providing critical products used in nucleic acid production and Biologics safety testing, including reagents and technologies that support mRNA-based Vaccine and therapeutic development. As a tools and reagents supplier rather than a clinical-stage drug developer, MRVI's price action tends to be sensitive to end-market Demand trends across its biopharma customer base, as well as periodic company-specific catalysts such as guidance updates, contract wins, or earnings surprises (marked with "E" flags on the chart). The scale of Thursday's volume — roughly 5-10x the stock's typical daily turnover — strongly suggests a significant news catalyst rather than routine trading activity.
Technical Perspective
The broader chart shows a stock that spent its first several months in a prolonged base-building phase, drifting in a range roughly between $3.00 and $4.50 from the prior December through into April, with both EMAs relatively flat and closely intertwined — a classic signature of an extended consolidation without clear directional conviction. That changed decisively in late April and into May, when the stock broke sharply higher, moving from around $3.50 up to $5.00 in a rapid advance, before continuing a more measured but steady climb through June and into early July, ultimately peaking near $7.00.
From that July high, the stock entered a corrective phase, drifting lower over several weeks and giving back a meaningful portion of its prior gains, bottoming out in the $5.60–$5.80 zone by mid-August. During this pullback, the RSI cooled substantially, falling from overbought territory near 80 in early July down to the low 40s by the days just before Thursday's session — reflecting fading momentum and increasing seller control.
Thursday's session sharply interrupted that corrective pattern. The stock gapped up at the open and continued climbing intraday to a high of $7.70 — surpassing the prior July peak — before settling back to close at $7.22, still a decisive reversal of the recent downtrend. This single session, on volume far exceeding anything else on the chart, both reclaimed the 21-day and 63-day EMAs and pushed price back above the previous swing high near $7.00, which is a technically meaningful development since it suggests the correction that began in July may now be over.
The RSI's rebound from 44.22 to 68.50 in one session reflects how abruptly sentiment shifted. While the reading is now approaching overbought territory, it has not yet reached the extreme levels seen in early July (when it pushed toward 80), suggesting there may still be some room for the move to extend before the same kind of overbought exhaustion sets in.
Key Technical Levels to Watch
On the upside, Thursday's intraday high of $7.70 is the immediate resistance to watch; a close above this level would put the stock at its highest point on the entire chart, opening the door to further gains without a clear historical ceiling to reference. The prior July peak near $7.00–$7.10 — now reclaimed — should convert to support on any pullback, serving as the first line of defense for bulls. Below that, the newly-reclaimed EMA cluster near $5.78–$6.23 represents the more significant support zone; a retreat back below this area would raise questions about whether Thursday's move was a durable reversal or a sharp, temporary bounce within an otherwise corrective phase.
Risk Factors
- Sharp Reversal Risk: A single-session gain of nearly 26% is a substantial move to sustain without additional follow-through buying, and some Retracement of the gain would not be unusual in the sessions ahead.
- Recent Downtrend Context: The stock was in a clear corrective phase for roughly six weeks immediately prior to this rally; one strong session, while encouraging, will need confirmation before it can be treated as a definitive trend change.
- Extreme Volume Spike: Volume this many multiples above the norm can sometimes reflect a one-time event (such as a short squeeze or a single large catalyst) whose effects may not persist in subsequent sessions.
- Small/Mid-Cap Volatility: Stocks of this size and price range are prone to outsized percentage swings in both directions, which can complicate the reliability of short-term technical signals.
Conclusion
Maravai LifeSciences' powerful reversal off its recent correction lows, on the heaviest volume seen across the chart, represents a meaningful technical development that has reclaimed both key moving averages and pushed price back above the prior July swing high. The momentum shift, reflected in the RSI's rapid climb from the low 40s to 68.50, adds further weight to the case that the pullback since July may have run its course. That said, given the size and speed of the move, confirmation will matter — a hold above the reclaimed EMA support near $5.78–$6.23 on any near-term pullback, combined with a subsequent close above the $7.70 intraday high, would strengthen the case that this marks a genuine resumption of the stock's broader uptrend rather than a temporary, catalyst-driven spike.
Note: This is a technical read based on price, volume, and indicator data — not a trading recommendation. I'm not a financial advisor, and large single-day moves like this are often driven by news events that Technical Analysis alone cannot fully anticipate or explain. Please do your own research or consult a professional before making Investment decisions.


 Nov 20, 2026





 Please wait processing your request...