
Key Highlights
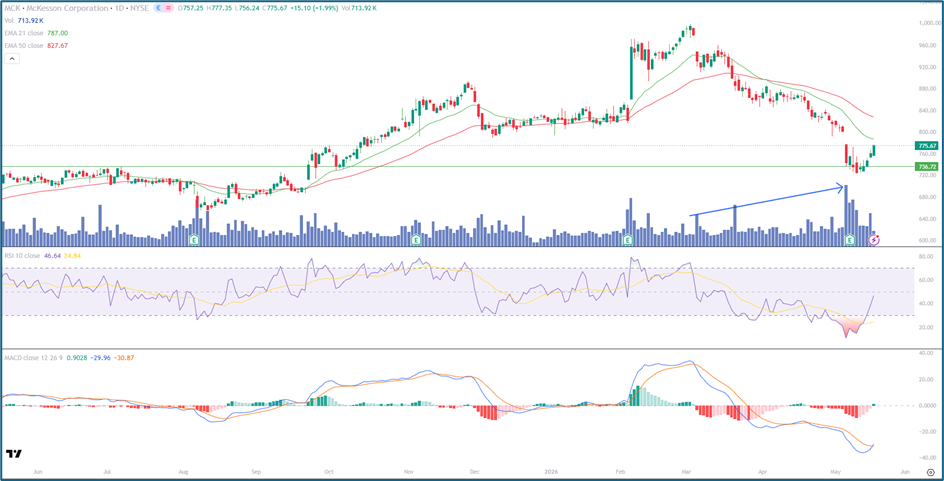
- McKesson is trading near $775.67, rebounding strongly from recent lows
• Price has bounced off a key horizontal support zone around $735–$740
• EMA-21 (~$787.00) and EMA-50 (~$827.67) remain overhead, keeping the broader trend under pressure
• RSI-10 at ~46 is recovering from oversold levels, indicating improving momentum
• Volume has expanded on the bounce, suggesting accumulation at lower levels
Source: Tradingview.com; Analysis by Kalkine Group
Trend Structure: Sharp Pullback Meets Strong Demand Zone
McKesson had been in a strong uptrend through late 2025 and early 2026, rallying toward the $950–$980 zone before entering a corrective phase. The recent decline brought the stock down sharply toward the $735 support level — a zone that previously acted as resistance and has now flipped into support.
The reaction from this level has been notable, with a sharp bounce indicating strong buying interest. This suggests that the current move could be the early stage of a recovery rally, particularly if higher lows begin to form from here.
Moving Averages: Key Resistance Levels to Watch
The Moving Average structure remains a hurdle for bulls:
• EMA-21 (~$787) — immediate resistance; first breakout trigger
• EMA-50 (~$827) — major resistance; defines broader trend
While the bounce is constructive, the stock needs to reclaim the EMA-21 to confirm short-term strength. A move above $800–$810 would further reinforce bullish momentum and shift the structure toward recovery mode.
Momentum & Volume: Signs of Accumulation Emerging
Momentum indicators are improving:
• RSI has rebounded toward neutral (~46), showing recovery from oversold conditions
• MACD is still negative but flattening, hinting at a potential bullish crossover
• Volume expansion on recent green candles suggests institutional buying interest
This combination often signals the transition from Capitulation to accumulation — an early phase of a potential trend Reversal.
Key Technical Levels and Scenarios
Resistance Levels
• $785–$800 — EMA-21 zone
• $825–$830 — EMA-50 resistance
• $900+ — prior swing highs
Support Levels
• $735–$740 — key demand zone
• $700 — next major support if breakdown occurs
Scenarios
- Recovery Rally (Primary Case) — Price holds above $740 and pushes toward $800–$830 as momentum builds.
- Consolidation (Secondary Case) — Stock ranges between $740–$800, forming a base before the next move.
- Bearish Continuation (Risk Case) — Breakdown below $735 resumes the downtrend toward $700.
Conclusion: Buyers Step In, But Confirmation Still Needed
McKesson is showing encouraging signs of a rebound after testing a critical support level, with improving momentum and rising volume suggesting accumulation. However, the broader trend remains under pressure until key moving averages are reclaimed.
For now, the setup favors a short-term recovery bias, with the next confirmation coming on a breakout above the $800 zone.


 Please wait processing your request...