
 CA
 NZ
 UK
 AU
 IND

 US

 Share
 X (Formerly Twitter)
 Whatsapp
 Facebook
 LinkedIn
 Telegram
 Email This Article
 Copy Link
 Summarize with AI
 Chat GPT
 Perplexity

Today's session saw a broad, synchronized pullback across a group of major pharmaceutical and healthcare-distribution names, with declines ranging from roughly 0.5% to over 2%. Unlike a sharp trend reversal, the move reads more as a pause within otherwise constructive setups — McKesson (NYSE: MCK) and Eli Lilly (NYSE: LLY) remain firmly above their key moving averages after strong multi-month recoveries, Novo Nordisk (NYSE: NVO) is digesting a sharp momentum spike after a multi-month rebound, and Pfizer (NYSE: PFE) continues to chop directly around its EMA cluster in a longer-term basing pattern.
McKesson Corporation (NYSE: MCK) — Holding Above Both EMAs Despite Today's Pullback
Key Highlights
- MCK trading at $814.04, down 1.79% ($14.80) on volume of 710.05K shares, after ranging between $808.56 and $840.00.
- Price remains above both the 20-day EMA ($803.73) and the 50-day EMA ($795.92), keeping the near-term structure intact despite today's decline.
- RSI sits at roughly 55.17, with the signal line at 59.74 — RSI has slipped below its signal line, pointing to cooling momentum after a recent push higher.
- MCK rallied from an August 2025 base near $600 to a February 2026 high near $970, then reversed sharply into a multi-month decline that bottomed near $720 in May 2026, before recovering back toward the $840 area into this week's pullback.
- Today's drop is the steepest single-day decline since the stock's recovery off the May low began.
Trend Structure MCK's chart shows a powerful late-2025 advance into a February 2026 peak, a sharp trendline breakdown into a May 2026 low, and a steady multi-month recovery back above both EMAs — with today's session representing the first notable give-back within that recovery rather than a change in structure. 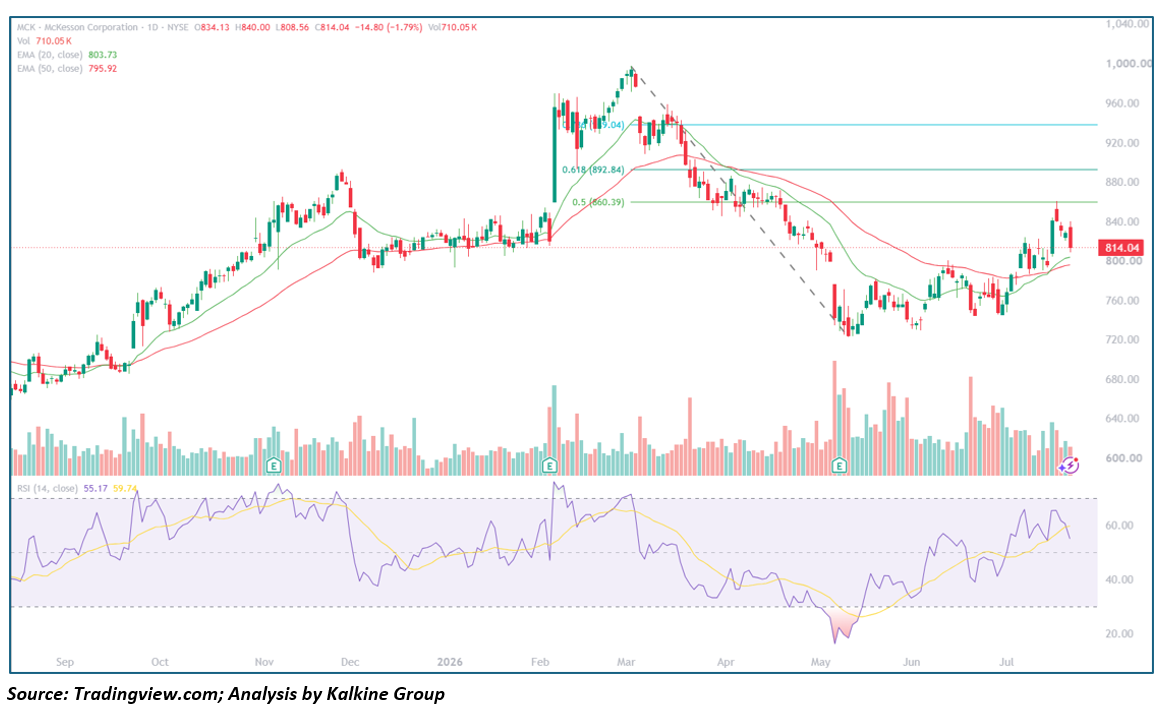
Key Technical Levels
Resistance
- $860.39 – 0.5 Fibonacci retracement of the Feb–May decline
- $892.84 – 0.618 Fibonacci retracement
- ~$955.00–$970.00 – February 2026 cycle high
Support
- $803.73 – 20-day EMA
- $795.92 – 50-day EMA
- ~$720.00 – May 2026 cycle low
Outlook MCK's pullback comes from a position of relative strength, with price still holding above both EMAs after a strong multi-month recovery. As long as the 50-day EMA near $796 holds, the broader recovery structure remains intact; a break below that level would open the door to a deeper retracement toward the $860 fib zone.
Novo Nordisk A/S (NYSE: NVO) — Sharp Momentum Cooldown After a Strong Rebound
Key Highlights
- NVO trading at $48.19, down 2.41% ($1.19) on volume of 8.25M shares, after ranging between $47.98 and $49.54.
- Price has slipped just below the 20-day EMA ($48.67) but remains above the 50-day EMA ($46.62).
- RSI has fallen to roughly 50.46, with the signal line at 63.33 — a sharp gap between RSI and its signal line, reflecting a fast cooldown in momentum after a strong run.
- NVO declined from an August 2025 high near $62 to a November 2025 low near $44, rallied to a February 2026 high near $64, then gapped sharply lower into a March 2026 low near $36, before staging a sustained recovery through July back toward the low-$50s.
- Today's decline marks the sharpest pullback since the multi-month recovery off the March low began.
Trend Structure NVO's chart shows a steady 2025 decline into a November low, a brief rally into a February 2026 peak that was violently reversed by a gap-down move, and then a long, grinding, multi-month recovery from the March low that has carried price back near the $50 handle — with today's drop representing an early test of that recovery. 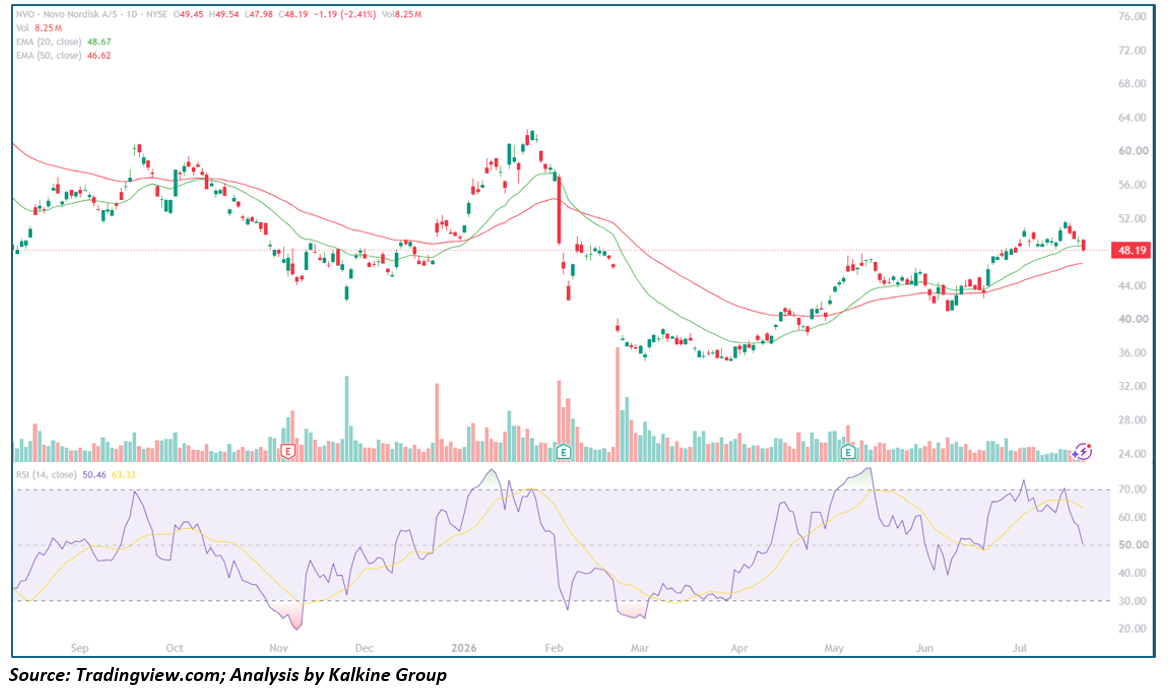
Key Technical Levels
Resistance
- $48.67 – 20-day EMA
- ~$52.00 – Recent June/July 2026 high
- ~$64.00 – February 2026 cycle high
Support
- $46.62 – 50-day EMA
- ~$36.00 – March 2026 cycle low
Outlook NVO's pullback is notable for how quickly RSI has dropped away from its signal line, suggesting momentum faded fast after an extended run. A close back above the 20-day EMA near $48.67 would keep the recovery on track; a slide below the 50-day EMA near $46.62 would be the first real crack in the multi-month rebound.
Eli Lilly and Company (NYSE: LLY) — Minor Give-Back Within a Strong Uptrend
Key Highlights
- LLY trading at $1,163.01, down 1.05% ($12.40) on volume of 1.55M shares, after ranging between $1,153.50 and $1,175.00.
- Price sits just below the 20-day EMA ($1,167.69) but remains well above the 50-day EMA ($1,122.18).
- RSI is at roughly 50.98, with the signal line at 57.18 — a modest pullback in momentum, though RSI remains in constructive territory.
- LLY declined from a late-2025 high into an April 2026 low near $880, then staged a powerful, sustained rally through May, June, and July to a fresh high near $1,250, before consolidating into today's mild pullback.
- Today's move is a routine give-back within an otherwise strong uptrend rather than a break of trend.
Trend Structure LLY's chart shows a multi-month decline bottoming in April 2026, followed by one of the strongest advances in the group — a near-uninterrupted climb from $880 to a July 2026 high near $1,250 — with price now consolidating just beneath the 20-day EMA after that extended run. 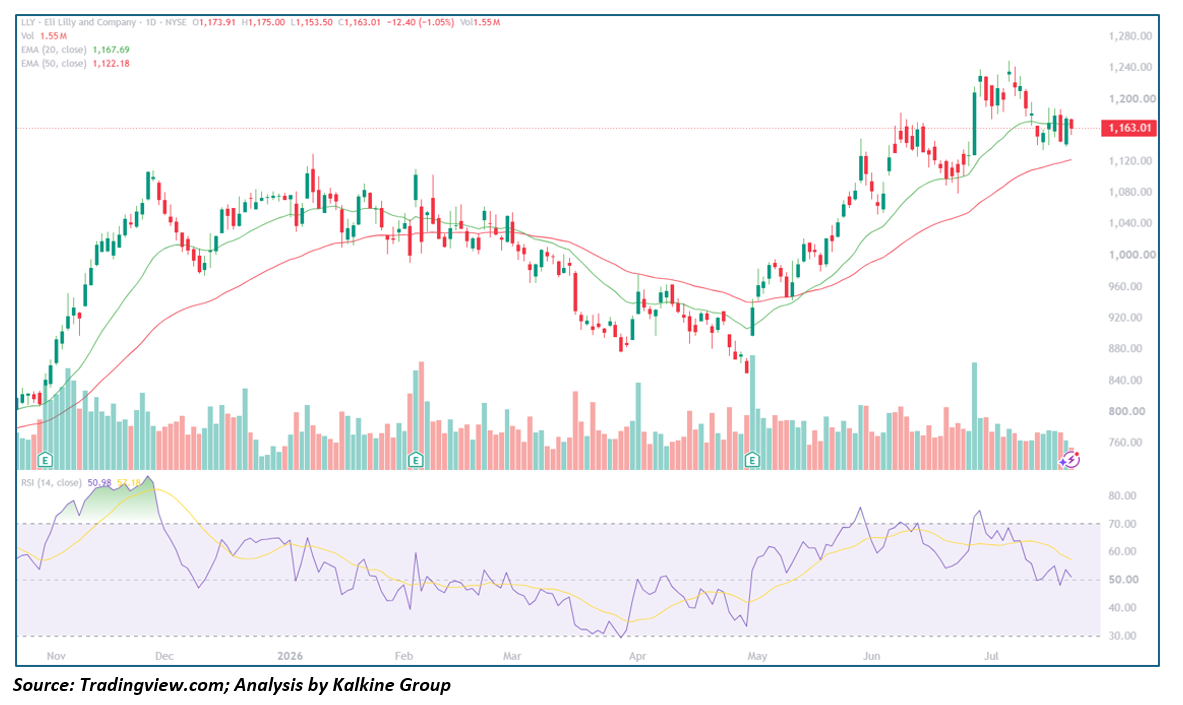
Key Technical Levels
Resistance
- $1,167.69 – 20-day EMA
- ~$1,250.00 – July 2026 cycle high
Support
- $1,122.18 – 50-day EMA
- ~$880.00 – April 2026 cycle low
Outlook LLY's pullback looks like routine consolidation after a steep, sustained advance, with price still comfortably above the 50-day EMA. A reclaim of the 20-day EMA near $1,168 would reaffirm the uptrend; a deeper slide toward the 50-day EMA near $1,122 would still keep the broader recovery structure intact.
Pfizer Inc. (NYSE: PFE) — Choppy Action Around the EMA Cluster, Smallest Decline of the Group
Key Highlights
- PFE trading at $24.82, down 0.48% ($0.12) on volume of 31.78M shares, after ranging between $24.78 and $25.19.
- Price sits just above the 20-day EMA ($24.70) but remains just below the 50-day EMA ($25.10), placing it directly inside a tight EMA cluster.
- RSI is at roughly 50.53, with the signal line at 45.76 — RSI remains above its signal line despite today's dip, consistent with a tentative stabilization attempt.
- PFE rallied from an October 2025 low near $21.50 to an April 2026 high near $28.20, then reversed into a summer decline that reached a fresh low near $23.50 in July, before staging a modest recovery back toward $25.
Today's decline is the smallest percentage move among the names covered, consistent with a stock caught in a tight, indecisive range.
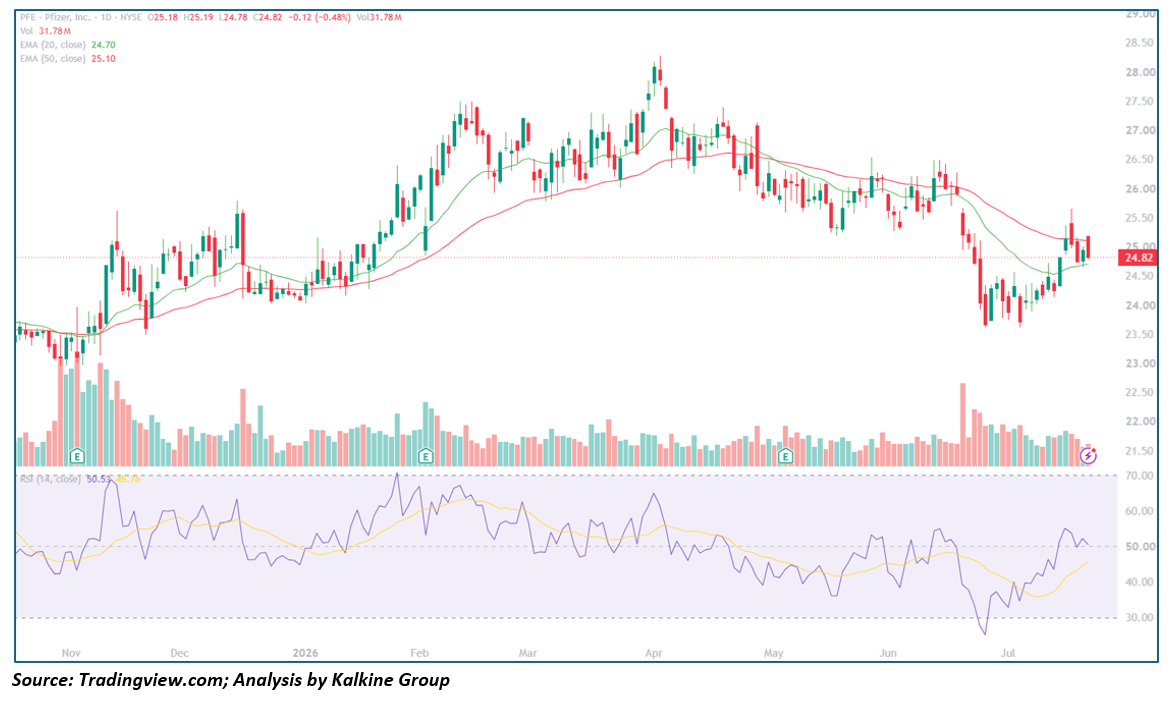
Trend Structure PFE's chart shows a solid rally from an October 2025 low into an April 2026 peak, followed by a lengthy, grinding decline through the spring and early summer to a fresh low in July — with the past two weeks marking an early attempt to stabilize right at the EMA cluster.
Key Technical Levels
Resistance
- $25.10 – 50-day EMA
- ~$28.20 – April 2026 cycle high
Support
- $24.70 – 20-day EMA
- ~$23.50 – July 2026 cycle low
Outlook PFE remains the laggard of the group in terms of trend clarity, chopping directly around its EMA cluster after a lengthy decline. A decisive close above the 50-day EMA near $25.10 would be the first real sign of stabilization; a fresh break below $23.50 would point to renewed downside pressure.
This analysis is based on daily chart technical indicators (20/50-day EMAs, RSI-14) and price action as of July 22, 2026, and is intended for informational purposes only — not investment advice.


 Nov 20, 2026





 Please wait processing your request...