
 CA
 NZ
 UK
 AU
 IND

 US

 Share
 X (Formerly Twitter)
 Whatsapp
 Facebook
 LinkedIn
 Telegram
 Email This Article
 Copy Link
 Summarize with AI
 Chat GPT
 Perplexity

Wednesday's session delivered a vertical breakout for Pacific Biosciences of California, Inc. (NASDAQ: PACB). The genomics-tools stock cleared a months-long ceiling near $1.80-$1.84 in one candle and closed at $2.42, its highest level since the January double top. Shares jumped sharply in the afternoon after EpiSign announced a methylation-analysis launch for PacBio's HiFi sequencing platform. The move capped a three-day advance of nearly 50% that began with a veterans-research contract and pre-conference optimism. The question now is whether buyers can defend the gains, since price is stretched far above its moving averages and momentum is deeply overbought. 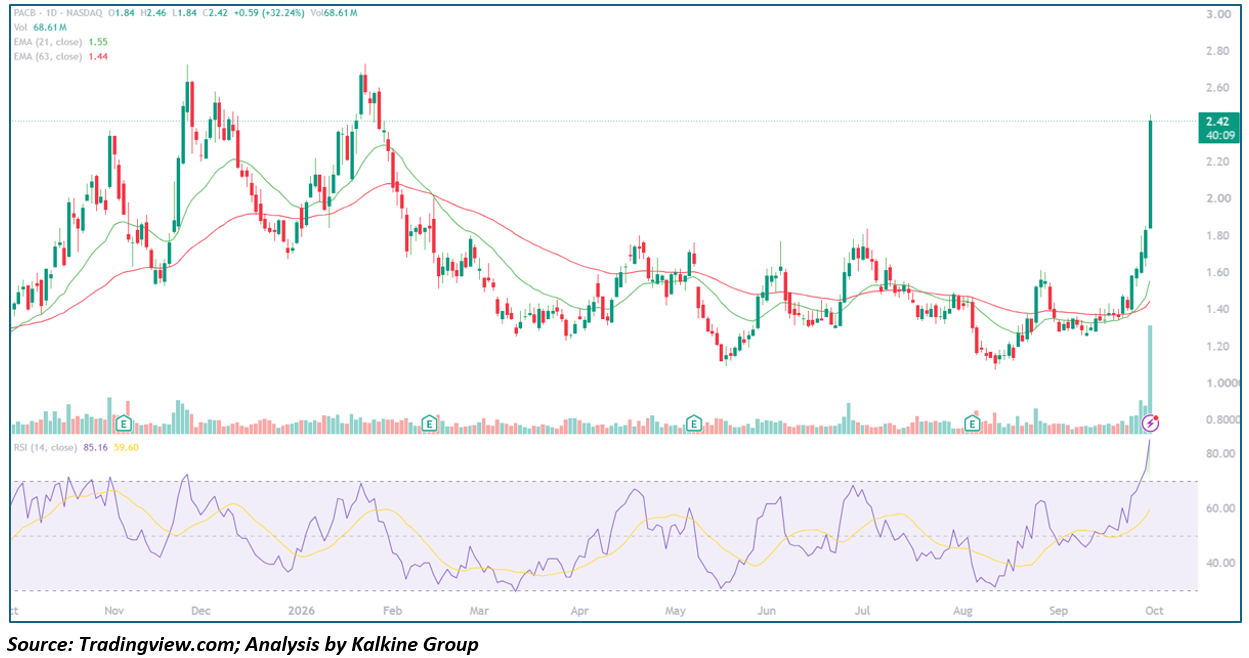
Key Highlights
- Closing Print & Intraday Execution:
- PACB closed at $2.42, up $0.59 (+32.24%), on Volume of 68.61M shares.
- That is roughly ten times its Average Daily Volume of about 6.6M shares.
- The stock opened at $1.84, near the prior close, and trended higher all session to a high of $2.46, finishing close to the top of its range.
- Options activity was unusually heavy, with about 13,700 calls traded against a daily average near 1,500.
- Exponential Moving Average Stack:
- The 21-day EMA sits at $1.55 and the 63-day EMA at $1.44, with the 21-day above the 63-day after turning up through it in September.
- Price is about 56% above the 21-day EMA and 68% above the 63-day EMA, an unusually wide gap that raises mean-reversion risk.
- Momentum Oscillator:
- The 14-day RSI has spiked to 85.16, far above its 59.60 signal line and well into overbought territory.
- Earlier rallies this year, in April and late June, stalled with RSI near 65-70. An 85 reading marks the strongest momentum on the chart.
- Fundamental Backdrop:
- Second-quarter Revenue was flat at $39 million, and the company lowered its full-year revenue outlook to $155-$165 million and pushed expected cash-flow breakeven to 2028.
- Cash stood below $237 million against nearly $645 million of debt.
- The analyst consensus rating is "Reduce" with an average price target of $1.71, so the stock now trades well above the average Street target.
- Short interest was about 17.5% in late September, which can amplify moves in both directions.
Trend Structure: Three-Act Reversal
PACB's Daily Chart over the past twelve months shows a double top, a long range and then a sudden breakout:
- Double Top & Markdown (November 2025 – May 2026): Shares peaked near $2.72 in late November and again in late January, a textbook double top. They then fell steadily, with lower highs and rallies rejected at the declining EMAs, and bottomed near $1.10 in May.
- Summer Range & Fundamental Reset (May – September 2026): The stock traded between roughly $1.08 and $1.84, repeatedly failing at $1.80-$1.84 in April and early July. The August Earnings release missed expectations, guidance was cut and a CEO transition was announced, driving a retest of the lows near $1.08. By September the stock had built a tight base at $1.27-$1.40 around its EMAs.
- Vertical Breakout (September 28 – 30): On Monday, a five-year contract worth up to $27.1 million from the U.S. Department of Veterans Affairs was announced for research using PacBio Revio systems, and the stock closed at $1.72, up 7.9%. Tuesday added about 6% as the company said its Leadership would join a fireside chat at the Morgan Stanley healthcare conference. Wednesday's EpiSign-driven surge then cleared the $1.80-$1.84 ceiling in a single session.
Moving Averages and Momentum Profile
- Dynamic Support Band: The 21-day EMA ($1.55) and 63-day EMA ($1.44) form the first structural support pocket, but both are far below the current price.
- Breakout Shelf: The former range ceiling at $1.80-$1.84 now acts as the first line of defense. Retests of old resistance as support are a common follow-through pattern after a breakout.
- Oscillator Behavior: With RSI at 85, short-term froth is high. Bulls will want to see a sideways consolidation that resets momentum, not a sharp reversal.
Key Technical Levels
|
Level |
Type |
Note |
|
$2.72 |
Resistance |
Late-November 2025 and late-January 2026 double top |
|
$2.46 |
Resistance |
Wednesday's intraday high |
|
$2.42 |
Reference |
Wednesday's close |
|
$1.80-$1.84 |
Support |
Former range ceiling (April and July highs) and breakout origin |
|
$1.55 |
Support |
21-day EMA |
|
$1.44 |
Support |
63-day EMA |
|
$1.27-$1.40 |
Support |
September base |
|
$1.08-$1.10 |
Support |
May and August lows |
Actionable Technical Outlook
- A daily close above $2.46 on solid volume would open a path toward the $2.72 double-top zone, where heavy Supply is likely.
- Near-term structure stays constructive while the stock holds above the $1.80-$1.84 shelf. A close back below it would suggest a failed breakout, with the 21-day EMA near $1.55 as the next reference.
- Overbought readings can persist during strong trends, but they also raise the odds of a sharp pullback or choppy consolidation. PACB is extremely volatile, with about 86 moves greater than 5% over the past year, and the Business is still loss-making with sizable debt. Earnings are currently listed for November 5, 2026, so expect wide swings in both directions. This is a technical read, not Investment advice.
Metadata
|
Field |
Value |
|
Headline |
Why did Pacific Biosciences (NASDAQ: PACB) stock surge 32% in one session, and can the breakout hold? |
|
SEO title |
Why PacBio (PACB) Stock Surged 32%: Key Levels |
|
Meta description |
Why did PacBio (NASDAQ: PACB) jump 32% to $2.42? RSI 85, EMA levels, support and resistance, Q2 results and risks for traders. |
|
Slug |
why-pacific-biosciences-pacb-nasdaq-stock-surged-technical-levels-risks |
|
Tags |
PacBio, PACB, NASDAQ, genomics, long-read sequencing, life science tools, EpiSign, RSI overbought, technical analysis |
|
Ticker |
PACB |
|
Index |
Not verified as a member of a major index (Nasdaq-listed small cap; not checked against index provider lists) |
|
Sector |
Healthcare (life science tools and genomic sequencing) |
|
Verification status |
PARTIAL |
|
Data as-of date |
2026-09-30 |


 Nov 18, 2026





 Please wait processing your request...