
 CA
 NZ
 UK
 AU
 IND

 US

 Share
 X (Formerly Twitter)
 Whatsapp
 Facebook
 LinkedIn
 Telegram
 Email This Article
 Copy Link
 Summarize with AI
 Chat GPT
 Perplexity

BMGL (NASDAQ: BMGL) is consolidating right at its 21-day EMA after a rebound from a sharp early-October low. As of this chart snapshot (about 16 minutes before the close), shares are trading at $3.84, down $0.01 (-0.26%). The stock opened at $3.94, which was also the intraday high, and reached a low of $3.80. The rebound is roughly 28% from the early-October closing lows near $3.00, but the stock is still about 60% below its May peak and far below its 63-day EMA. I did not check for a company-specific catalyst, so the case rests on the chart. 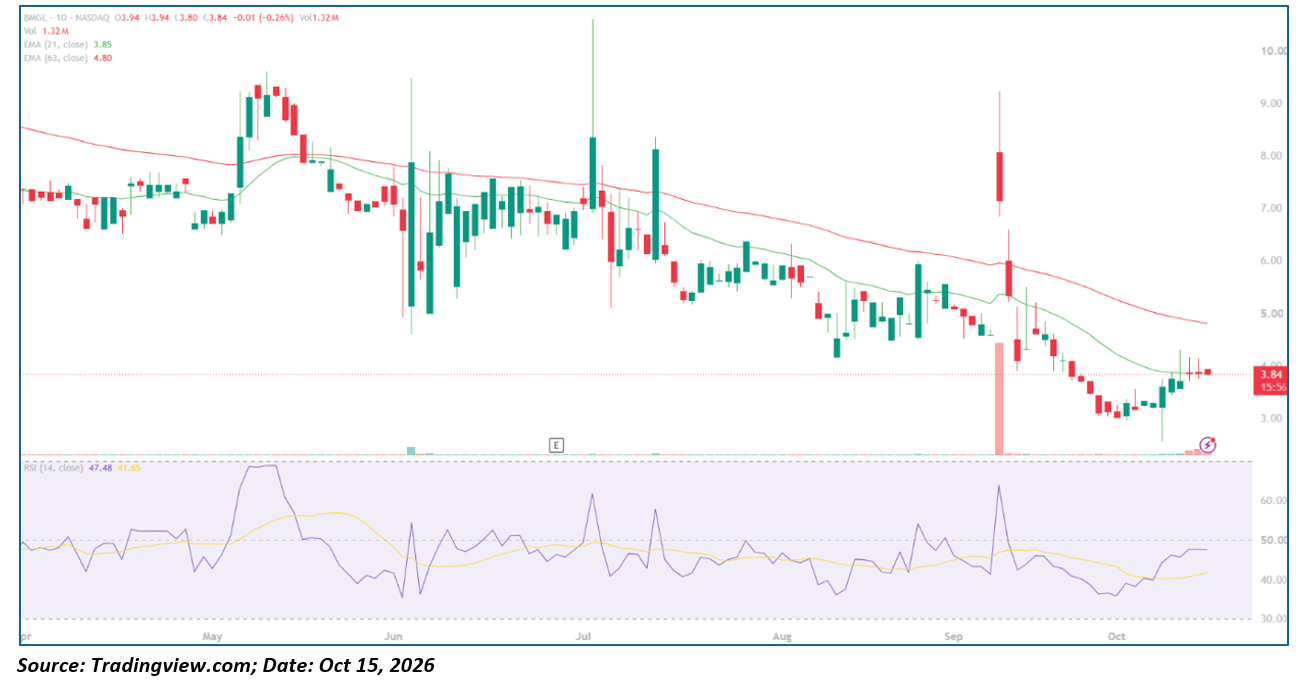
Key Highlights
- Trading at $3.84, down $0.01 (-0.26%), on partial-session Volume of 1.32M shares.
- Opened at $3.94 (the day’s high), low of $3.80.
- The 21-day EMA is about $3.85 and the 63-day EMA is about $4.80. Price is right at the 21-day and below the 63-day.
- The 14-day RSI is 47.48, above its signal line near 41.7 but below the 50 midline.
- Resistance is at about $4.00–4.30, the 63-day EMA near $4.80 and $5.00, with support at $3.80, about $3.55 and $3.00.
Trend Structure: Four-Act Pattern
- Range (April 2026): BMGL traded around $6.60–7.60, with the 21-day and 63-day EMAs sloping down and rallies fading.
- Spike and Fade (May–June 2026): In early May the stock jumped to about $9.50, with RSI reaching about 69. It then slid back to the $7.00 area by late May. In June it traded in a wide, volatile range with long wicks, from about $4.60 to $9.50.
- Volatile Decline (July–early September 2026): After the mid-year Earnings marker, the stock produced another long upper wick to about $10.60 in early July. It then declined through July and August to about $4.20 before a rally to about $6.00 in late August. In early September a huge spike candle on the heaviest volume on the chart took price briefly above $9.00. It reversed the same day and closed near $6.00.
- Collapse and Rebound (September–October 2026): After the spike, the stock fell steadily to about $3.00 by the start of October. A long lower wick to about $2.55 showed buyers stepping in, and price then rebounded through the 21-day EMA. Rallies in mid-October reached $4.30 but were rejected, and price has since traded sideways near $3.80–3.95.
Backdrop
Volume is extremely thin for most of the chart. Apart from the early-September spike and a bar in June, most sessions trade on very low volume, and several long wicks on the chart show that a few trades can move the price sharply. Today’s partial volume of 1.32M is among the larger recent bars, but it is small next to the September spike. The “E” marker on the chart suggests a report around mid-to-late June. Confirm the next earnings date, since reports have been followed by large moves.
The chart alone does not establish whether a company-specific catalyst is driving the latest move. Company announcements, financing and share issuance, and broader sector sentiment should be checked separately before attributing the rebound to a fundamental event. For a stock with this much Volatility and thin volume, it is also worth checking for corporate actions such as reverse splits or offerings.
Moving Averages and Momentum Profile
- Candle Dynamics: Today’s open at $3.94 was the high of the day, and price eased to $3.80 before settling at $3.84. The latest candle is a small bearish candle just under $4.00, with the first visible rejection at the round number. Similar small candles over the past few sessions show the stock pausing rather than advancing.
- Moving Average Stack: Price is almost exactly on the 21-day EMA (about $3.85), which has flattened after a steep decline and acts as the pivot for the current range. The 63-day EMA (about $4.80) is still falling and sits roughly 25% overhead. A close above the 21-day would be an early positive, but the 63-day is a distant test.
- Oscillator Behavior: RSI at 47.48 has recovered from about 35 in early October and sits above its signal line, but it has flattened below 50. Momentum has stabilized without confirming a trend change.
- Volume Behavior: Volume has been very low during the October rebound, which makes the move less reliable. A break above $4.00–4.30 on volume well above recent sessions would carry more weight.
Key Technical Levels
|
Level |
Type |
Note |
|
~$5.00 |
Resistance |
Early-September breakdown area |
|
~$4.80 |
Resistance |
63-day EMA |
|
~$4.30 |
Resistance |
Mid-October rejection high |
|
$4.00 |
Resistance |
Round number and recent session highs |
|
$3.85 |
Pivot |
21-day EMA |
|
$3.84 |
Reference |
Current price |
|
$3.80 |
Support |
Today’s low |
|
~$3.55 |
Support |
Early-to-mid-October consolidation lows |
|
~$3.00 |
Major support |
Early-October closing lows |
|
~$2.55 |
Major support |
Early-October wick low |
Historical levels are approximate readings from the supplied daily chart. The chart does not provide exact closing prices for all earlier swing points. The latest candle was still forming, so today’s high, low and close can change.
Actionable Technical Outlook
- Bullish Scenario: A close above $4.00, followed by a close above the $4.30 rejection high, would break the October range and put $5.00 and the 63-day EMA in focus. The move would carry more weight if volume expanded well above current levels.
- Pullback Scenario: With RSI flat below 50 and the stock stalling at the 21-day EMA, BMGL could consolidate between about $3.55 and $4.00 while the averages catch up. A pullback that holds $3.55 and then draws buyers would help validate the rebound.
- Bearish Scenario: A close below $3.80, and especially below $3.55, would put the stock back near its October base, and a break of $3.00 would suggest the rebound has failed. A rejection at $4.00 would leave a lower-high structure below a falling 63-day EMA.
- Momentum Confirmation: The bullish outlook would improve if RSI moves above 50, price holds above the 21-day EMA, and volume rises on advances. An RSI drop below 40 alongside a close under $3.55 would warn of fading momentum.
The immediate technical question is whether BMGL can reclaim and hold the 21-day EMA and then clear the $4.00–4.30 zone. The rebound from the lows has been strong, but the stock is still in a long downtrend, Liquidity is thin and the chart is full of reversals. Waiting for a confirmed breakout on stronger volume is less risky than chasing. This is a technical read, not Investment advice.
Metadata
|
Field |
Value |
|
Headline |
Why is BMGL (NASDAQ: BMGL) slipping 0.26% to $3.84 at its 21-day EMA, and can it clear $4.00? |
|
SEO title |
BMGL Stock Near $4.00 Resistance: RSI and EMA Levels |
|
Meta description |
BMGL (NASDAQ: BMGL) slips 0.3% to $3.84 at its 21-day EMA. RSI 47, $4.00 resistance and key support levels for traders. |
|
Slug |
bmgl-stock-technical-analysis-4-00-resistance-rsi |
|
Tags |
BMGL, NASDAQ, technical analysis, moving averages, RSI, micro-cap stocks |
|
Ticker / Sector |
BMGL / Not confirmed |
|
Verification status |
PARTIAL (levels read from the chart; company name, sector, catalyst, earnings date and 52-week range not confirmed) |
|
Data as-of date |
October 15, 2026 (intraday; chart snapshot about 16 minutes before the US close, captured October 16, 2026, 01:14 IST) |


 Nov 20, 2026





 Please wait processing your request...