
 CA
 NZ
 UK
 AU
 IND

 US

 Share
 X (Formerly Twitter)
 Whatsapp
 Facebook
 LinkedIn
 Telegram
 Email This Article
 Copy Link
 Summarize with AI
 Chat GPT
 Perplexity

Eli Lilly and Company (NYSE: LLY) is slipping modestly on Thursday as sellers keep control of a stock that has spent six weeks failing to hold above its moving averages. As of this chart snapshot (about 30 minutes before the close), shares are trading at $1,154.40, down $2.68 (-0.23%). The stock opened at $1,155.00, touched a low of $1,139.85 and failed to hold a high of $1,158.72. It now sits right on the 63-day EMA and below the 21-day EMA, after Wednesday's sharp rejection from the $1,200 area. I could not find a company-specific catalyst for today's move, so the case rests on the chart. 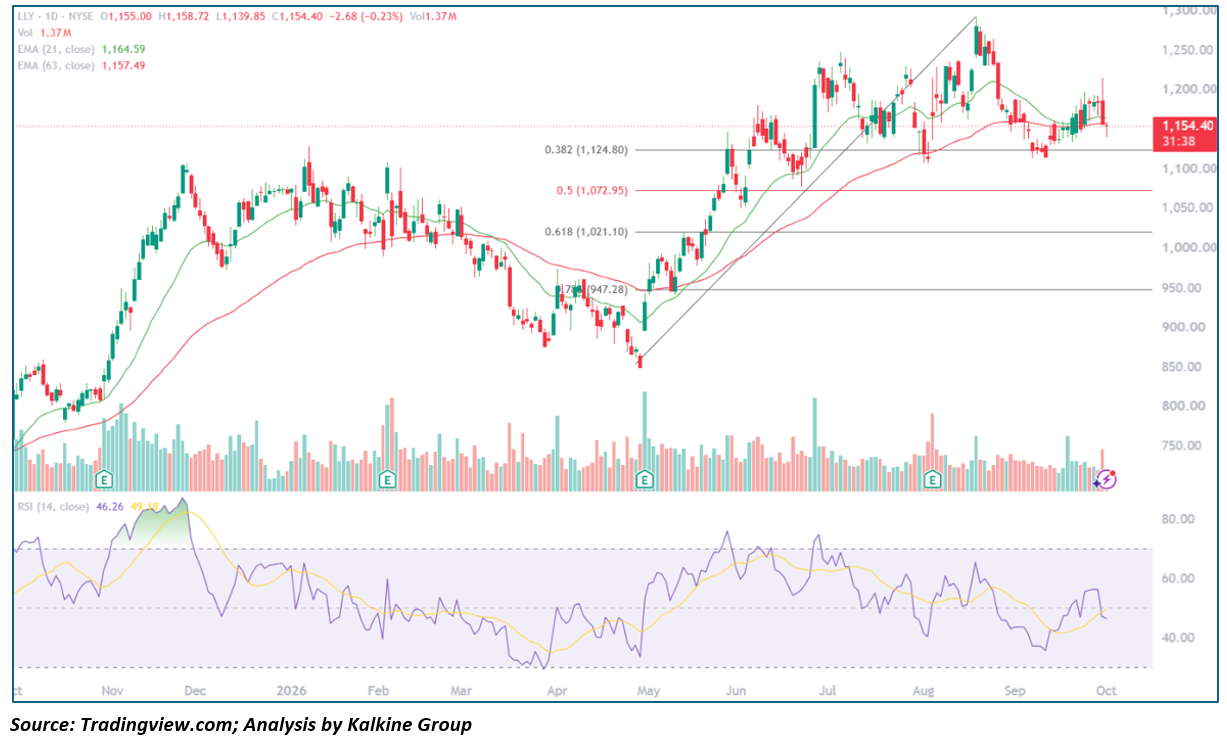
Key Highlights
- Trading at $1,154.40, down $2.68 (-0.23%), on partial-session Volume of 1.37M shares
- Opened at $1,155.00, low of $1,139.85, high of $1,158.72
- 21-day EMA at $1,164.59 (price below); 63-day EMA at $1,157.49 (price just below)
- 14-day RSI at 46.26, below its 49.18 signal line
- Resistance at $1,164.59 and $1,215; Fibonacci support at $1,124.80, $1,072.95 and $1,021.10
Trend Structure: Three-Act Pattern
- Advance and Range (October 2025 – April 2026): The stock climbed from the $800s in October to about $1,100 in late November, with RSI above 80 at the top. It then chopped between roughly $980 and $1,100 into February before sliding to a cycle low near $850 in late April.
- Impulse Rally (May – August 2026): The recovery was strong and steady, taking price from $850 to a peak near $1,290 in mid-August. The Fibonacci Retracement drawn on the chart spans that swing from the April low to the August high.
- Retracement and Compression (late August – October 2026): The pullback has held above the 38.2% level at $1,124.80, with lows near $1,110 to $1,120 in early and mid-September. A rebound to about $1,190 in late September stalled, and Wednesday's long upper wick near $1,215 followed by a red close shows the rally was rejected.
Backdrop
The next Earnings report is typically due in late October to early November, so confirm the date, as results are likely the next major catalyst. The stock is about 10% below its August peak, and the market is deciding whether this is a pause in the larger uptrend or the start of a deeper retracement.
Moving Averages and Momentum Profile
- Moving Average Stack: The 21-day EMA ($1,164.59) sits above the 63-day EMA ($1,157.49), so the longer-term alignment is still positive, but price has slipped below both and the EMAs are flattening.
- Oscillator Behavior: RSI at 46.26 has dropped back under 50 and below its signal line, which points to fading momentum but not an oversold condition.
- Volume Behavior: Volume of 1.37M is partial, with the session still open, and is below the spikes seen on the May breakout and the August peak.
- Candle Structure: The stock traded as low as $1,139.85 and recovered most of that, so buyers are defending the area near $1,140 for now.
Key Technical Levels
|
Level |
Type |
Note |
|
$1,290 |
Resistance |
Mid-August cycle high |
|
$1,245–$1,250 |
Resistance |
July high |
|
$1,215 |
Resistance |
Wednesday's rejection wick |
|
$1,164.59 |
Resistance |
21-day EMA |
|
$1,158.72 |
Resistance |
Today's intraday high |
|
$1,154.40 |
Reference |
Current price |
|
$1,157.49 |
Pivot |
63-day EMA |
|
$1,139.85 |
Support |
Today's low |
|
$1,124.80 |
Support |
38.2% Fibonacci retracement |
|
$1,072.95 |
Support |
50% retracement |
|
$1,021.10 |
Support |
61.8% retracement |
Actionable Technical Outlook
- The key test is the $1,124.80 retracement level. A daily close below it would open the $1,072.95 level, where the 50% retracement lines up with the early-July consolidation zone.
- A close back above the 21-day EMA near $1,165 would improve the tone and put $1,190 to $1,215 back in view. A move through $1,215 would be needed to challenge the August high.
- The bias is neutral to cautiously bearish while price stays below the 21-day EMA. This is a technical read, not Investment advice.
Metadata
|
Field |
Value |
|
Headline |
Why is Eli Lilly (NYSE: LLY) stalling at its 63-day EMA, and is the 38.2% retracement next? |
|
SEO title |
Eli Lilly (LLY) Stalls at 63-Day EMA: Fibonacci Levels to Watch |
|
Meta description |
Eli Lilly (NYSE: LLY) trades at $1,154 on its 63-day EMA. RSI 46, 38.2% retracement at $1,124.80 and key support and resistance levels. |
|
Slug |
why-eli-lilly-lly-nyse-stock-stalls-63-day-ema-fibonacci-levels |
|
Tags |
Eli Lilly, LLY, NYSE, pharmaceuticals, Fibonacci retracement, technical analysis, moving averages |
|
Ticker / Sector |
LLY / Health Care |
|
Verification status |
PARTIAL (levels read from the chart; catalyst not confirmed) |
|
Data as-of date |
October 1, 2026 (intraday) |


 Nov 17, 2026





 Please wait processing your request...