
 CA
 NZ
 UK
 AU
 IND

 US

 Share
 X (Formerly Twitter)
 Whatsapp
 Facebook
 LinkedIn
 Telegram
 Email This Article
 Copy Link
 Summarize with AI
 Chat GPT
 Perplexity

Moderna, Inc. (NASDAQ: MRNA) is seeing sharp profit-taking after a steep, months-long advance. As of this chart snapshot (about 55 minutes before the close), shares are trading at $212.45, down $12.55 (-5.58%), on partial-session Volume of 10.18M shares. The stock opened at $224.50 near Friday's close of about $225.00, spiked to a new cycle high of $227.46 and then sold off through the session to a low of $212.31, so it is trading at the bottom of its range. The drop erases most of Friday's strong gain and leaves a bearish Reversal candle at the highs. I could not find a company-specific catalyst, so the case rests on the chart. 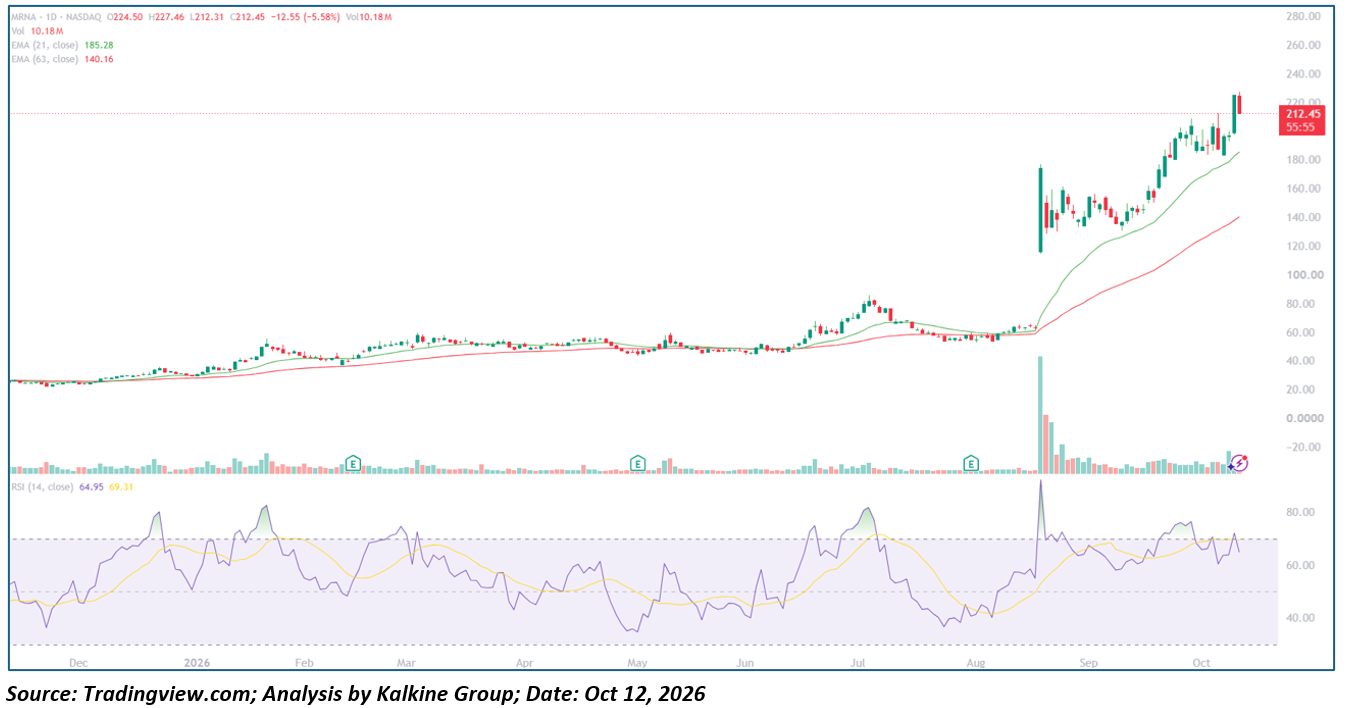
Key Highlights
- Trading at $212.45, down $12.55 (-5.58%), on partial-session volume of 10.18M shares
- Opened at $224.50, high of $227.46, low of $212.31
- 21-day EMA at $185.28 and 63-day EMA at $140.16, both well below price
- 14-day RSI at 64.95, below its 69.31 signal line and turning down from above 70
- Resistance at $227.46 and $225; support at $212.31, $200 and the 21-day EMA near $185
Trend Structure: Three-Act Pattern
- Base and Range (November 2025 – June 2026): MRNA started near $25 in November and climbed to about $55 by late January. It then ranged between roughly $45 and $60 from February through June, hugging both EMAs with several RSI readings near 80 along the way.
- Spike and Pullback (June – early August 2026): The stock rose to about $85 in early July, then gave back about 35% to a low near $55 in early August.
- Vertical Breakout and Extension (mid-August – October 2026): A gap higher in mid-August lifted the stock from about $65 to an area near $115 to $177 on the heaviest volume of the chart, and RSI spiked to about 92. It consolidated between about $130 and $160 through early September, then rallied to about $210 in late September. A pullback to about $182 in early October held near the 21-day EMA, and a strong green bar on Friday carried it to about $225. Today's drop comes right after the cycle high. The stock is still more than four times its early-August low.
Backdrop
The next quarterly Earnings report is typically due in early November, so confirm the date. The earnings markers on the chart line up with the late-winter, early-May and early-August periods, but the mid-August gap came after the last report and was the largest move on the chart. A move of that size usually has a news-driven cause, so check for company or sector headlines that explain both the August gap and today's reversal.
Moving Averages and Momentum Profile
- Moving Average Stack: The 21-day EMA ($185.28) is above the 63-day EMA ($140.16), and both are rising steeply. That is a bullish stack. Price is about 15% above the 21-day and about 52% above the 63-day, so the stock is extremely extended and far from any average. Extended readings often mean-revert toward the 21-day EMA, which has not been touched since the early-October pullback.
- Candle Behavior: Today's candle is a large red bar that opened near Friday's close, spiked to a new high and closed near its low, with a small upper wick and almost no lower wick. A reversal like this right after a new high shows sellers taking control and often marks a short-term top, though it needs a lower close to confirm.
- Oscillator Behavior: RSI at 64.95 has rolled over from above 70 and slipped below its signal line at 69.31. It failed at 75 in late September and again today, which is a mild bearish divergence against the higher price highs. A drop under 60 would confirm that momentum is fading.
- Volume Behavior: Volume of 10.18M is partial, with the session still open, and is well below the mid-August surge. A close on heavy volume would give the reversal more weight, while a quiet close would suggest a routine pullback.
Key Technical Levels
|
Level |
Type |
Note |
|
$227.46 |
Resistance |
Today's intraday high, cycle high |
|
$225.00 |
Resistance |
Friday's close (derived from today's change) |
|
$224.50 |
Resistance |
Today's open |
|
$212.45 |
Reference |
Current price |
|
$212.31 |
Support |
Today's low |
|
$210 |
Support |
Late-September swing high (approximate) |
|
$200 |
Support |
Round number, psychological level |
|
$185.28 |
Support |
21-day EMA |
|
$182 |
Support |
Early-October swing low (approximate) |
|
$140.16 |
Support |
63-day EMA |
Actionable Technical Outlook
- A close below today's low at $212.31 would confirm the reversal and put $200 in play. A close below $200 would open the way toward the early-October low near $182 and the 21-day EMA near $185.
- A close back above $225 would cancel the reversal and put the $227.46 high in play again. A move through $227.46 would resume the uptrend and set another cycle high.
- The stock is more than 50% above its 63-day EMA, so a deeper pullback toward the 21-day EMA would not break the trend. A retest of $220 to $225 is possible before any further decline. After a fourfold run, moves of 5% or more in either direction are common. This is a technical read, not Investment advice.
Metadata
|
Field |
Value |
|
Headline |
Why is Moderna (NASDAQ: MRNA) reversing 5.6% to $212.45 from a $227 high after a fourfold run, and can it hold $200? |
|
SEO title |
Moderna (MRNA) Falls 5.6% to $212.45: Reversal at $227 High and $200 Support |
|
Meta description |
Moderna (NASDAQ: MRNA) drops 5.6% to $212.45 after a new cycle high at $227.46. RSI 65, key support and resistance levels for traders. |
|
Slug |
why-moderna-mrna-nasdaq-stock-reverses-227-high-200-support |
|
Tags |
Moderna, MRNA, NASDAQ, biotechnology, technical analysis, moving averages, bearish reversal |
|
Ticker / Sector |
MRNA / Health Care |
|
Verification status |
PARTIAL (levels read from the chart; catalyst not confirmed) |
|
Data as-of date |
October 12, 2026 (intraday; chart snapshot taken October 13 at 00:34 IST, about 55 minutes before the US close) |


 Nov 20, 2026





 Please wait processing your request...