
Shares of micro-cap Dreamland Limited dominated US trading on 13 May 2026, posting a 876.69% single-session advance on more than 108 million shares — a move that turned a low-profile listing into one of the most discussed tickers on retail screeners.
Key Highlights
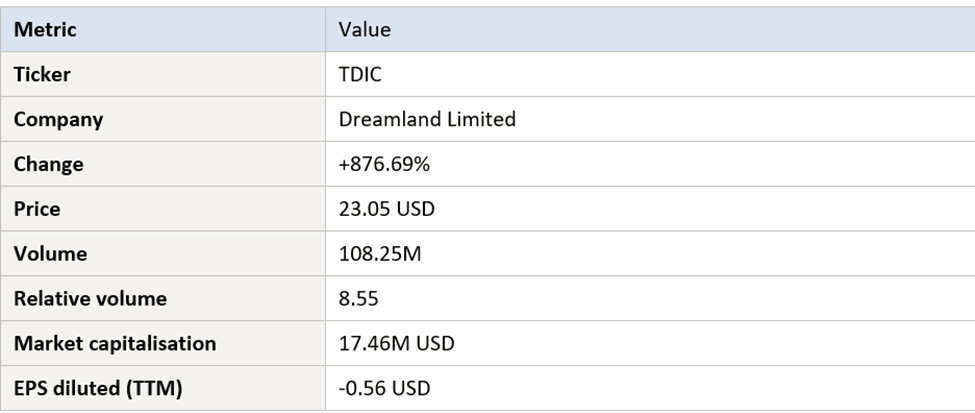
- TDIC closed the screener at USD 23.05, up 876.69% intraday.
- Reported Volume of 108.25 million shares ran at 8.55× its typical pace, signalling abnormal participation.
- Capitalisation/">Market Capitalisation was listed at just USD 17.46 million, classifying TDIC as a deep micro-cap.
- EPS diluted (TTM) stood at -USD 0.56, indicating ongoing losses on a trailing basis.
- Extreme one-day moves in low-float micro-caps frequently retrace sharply on subsequent sessions.
What Happened
Dreamland Limited (Nasdaq:TDIC) topped Top Gaining US Stocks on 13 May 2026, with the platform recording a single-session price increase of 876.69% to a reference level of USD 23.05. The move placed TDIC at the head of the screener's leaderboard, well clear of the next-best advancers for the session.
Volume tracked the price action almost dollar-for-dollar. The screener logged 108.25 million shares changing hands — approximately 8.55 times the stock's typical activity. For a company with a listed market capitalisation of roughly USD 17.46 million, that level of turnover is unusual and points to a sharp expansion in the number of traders interacting with the name.
The screener did not surface a specific corporate catalyst — no press release, Earnings update, or regulatory disclosure was attached to the entry. Instead, TDIC's appearance is best understood as a technical and behavioural event: a low-priced micro-cap suddenly absorbing a multiple of its usual Liquidity. Moves of this magnitude in stocks of this size are typically driven by Momentum Trading, Social Media attention, and short-term speculative flows rather than fundamental developments.
Market Context
The US Equity market on 13 May 2026 saw a familiar dispersion between large-cap benchmarks and the speculative end of the small-cap and micro-cap universe. While headline indices typically reflect broad sector flows, screener leaderboards such as Top Gainers list tend to be dominated by names with constrained float, low absolute share prices, or thin coverage from Sell-Side analysts.
Within that universe, Dreamland Limited's move sat alongside a cluster of other extreme advancers, including names like Robo.ai (AIIO) and Antelope Enterprise Holdings (AEHL). Such clusters often emerge during periods when traders rotate aggressively into low-cap stocks in search of outsized short-term returns, particularly when broader benchmarks are range-bound or when Volatility is concentrated in specific sectors.
Liquidity dynamics are central to interpreting these moves. A small market cap means that even modest absolute dollar flows can move price meaningfully. When such flows are amplified by Margin trading, Options activity, or social-media-driven coordination, the resulting price action can dwarf anything seen in larger, more efficiently-priced parts of the market.
It is also worth noting that micro-cap leaderboard names can be subject to enhanced scrutiny from exchanges and regulators when unusual activity persists. Trading halts, volatility pauses, and information requests are not uncommon following moves of this magnitude.
Company Overview
Dreamland Limited is a small-capitalisation company listed on a US exchange, with the ticker TDIC. With a reported market capitalisation of approximately USD 17.46 million prior to the 13 May 2026 session, the company sits firmly in the micro-cap segment of the US market.
What can be observed is the financial fingerprint of a small, unprofitable issuer: a low share count relative to large-cap peers, trailing-twelve-month Diluted Earnings per Share of -USD 0.56, and the kind of price profile that is commonly observed in development-stage or newly-listed enterprises.
Screener Data
Several elements of the screener data stand out. The 876.69% change is at the extreme upper end of what is typically observed even within the small-cap segment, and the relative volume reading of 8.55 confirms that participation was unusually high relative to the stock's recent baseline. Together, these figures describe a market that was unusually crowded for a single trading day.
The combination of a low market capitalisation and high absolute volume is a recurring pattern in screener-leading names. A market cap of USD 17.46 million implies a relatively small share count and modest free float, conditions under which large dollar flows can produce disproportionate price changes. The trailing diluted EPS of -USD 0.56 indicates that the underlying Business has not generated trailing-twelve-month profitability, which sits in tension with the day's market-implied enthusiasm.
Readers attempting to analyse the move should therefore weigh the screener-level data against the practical reality that snapshot metrics do not capture intraday volatility, after-hours behaviour, or any corrective price action that may have followed.
Risks to Watch
Retracement risk after an extreme one-day move
Single-session moves of several hundred per cent in micro-cap stocks are statistically prone to substantial retracements in the days that follow. Traders who enter near the highs may be exposed to rapid mark-to-market losses if momentum fades, particularly if the move was not anchored in a confirmed fundamental catalyst.
Liquidity and execution risk
A market capitalisation of USD 17.46 million and a previously thin trading profile mean that, once short-term traders begin exiting, bid-ask spreads can widen materially. Investors may find that orders Fill at materially different prices than indicated on screen, especially during fast markets.
Information asymmetry
When no clear catalyst is visible, retail traders often respond to social media chatter and momentum signals rather than verifiable corporate information. This raises the risk of trading on rumour or misinterpretation. Regulators have repeatedly highlighted micro-cap volatility as a focus area in their investor education materials.
Trading Patterns and Liquidity
Beyond the headline +876.69% change, the trading pattern visible from the screener provides a useful lens on how Dreamland Limited actually moved through the session. The combination of a 23.05 USD reference level, reported volume of 108.25M, and a relative volume reading of 8.55 is informative in itself. Each of these figures captures a different facet of the market's reaction: price reflects the marginal valuation, volume measures aggregate participation, and relative volume contextualises that participation against the stock's own history.
In a market cap band reported at 17.46M USD, sustained moves typically require either a meaningful change in the perceived fundamental story or a substantial shift in the composition of the stock's investor base. One-day spikes that are not anchored in confirmed catalysts can be informative about market psychology but provide limited evidence about durable value creation. Traders evaluating TDIC in the days that follow will want to watch whether the elevated volume profile is sustained, whether intraday ranges narrow, and whether bid-ask spreads tighten as the session's enthusiasm normalises.
Liquidity considerations also matter. When a stock's traded volume runs at multiples of its average, the order book can briefly look very different from its usual state. In particular, market depth — the size of resting orders at each price level — can appear larger than it really is during the spike and thinner than it really is once the rush fades. For TDIC, that means execution conditions encountered during the 13 May 2026 session may not be representative of typical days, and investors should plan position sizing and exit strategies accordingly.
How This Move Compares to Other Top Gainers
Placing TDIC's +876.69% move in context with other names on the 13 May 2026 Top Gaining US Stocks screener helps highlight what made the session distinctive. On the same day, leaderboard names ranged from deeply micro-cap issuers such as Dreamland Limited (TDIC) and Fitness Champs Holdings (FCHL) to larger small- and mid-caps like Ouster (OUST) and SELLAS Life Sciences (SLS). That breadth — both in sector and in market capitalisation — suggests the day's risk-on tone was broadly distributed rather than confined to a single theme.
Within that mixed cohort, TDIC sat alongside companies from healthcare, advanced Manufacturing, energy transition, and financial services. Although each of these names has its own operating story, their simultaneous appearance on the screener illustrates a pattern frequently observed in US markets: when small- and micro-cap appetite returns, Capital tends to disperse across themes rather than concentrate in one. That dispersion can itself be a signal worth tracking, because it differentiates broad-based risk-on sessions from sentiment events focused on a single sector.
The relative-volume reading of 8.55 for TDIC should be read against the wide range observed in the day's gainers. Some names featured relative volumes in the high 20s, 30s, and even above 70, while others showed more moderate spikes in the 2–6 range. Where a particular stock sits in that distribution offers a clue about how unusual the day's activity was for that specific name — a more meaningful comparison than focusing solely on the headline percentage gain.
Investor Outlook
From an investor outlook perspective, TDIC's 13 May 2026 session is best framed as a momentum event rather than the start of a structurally re-rated stock. Without verifiable catalysts, the move's durability is uncertain, and the price could revisit either much higher or much lower levels in subsequent sessions.
Longer-term investors typically place greater weight on Revenue growth, margin trajectory, and balance-sheet resilience than on a single day of screener-leading activity. For TDIC, none of those fundamental dimensions can be assessed from the screener alone, and the negative trailing EPS suggests careful diligence is required before treating the name as anything other than a speculative position.
Short-term traders, by contrast, may continue to watch TDIC for follow-through patterns, exhaustion signals, and any official disclosures that surface in the days following the move. Risk management — including position sizing appropriate to a high-volatility micro-cap — is critical in this context.
Ultimately, the way TDIC trades in the sessions after this move will say as much about the current appetite for speculative US small-caps as it does about Dreamland Limited itself.


_06_10_2026_23_39_42_651574.jpg)


 Please wait processing your request...