
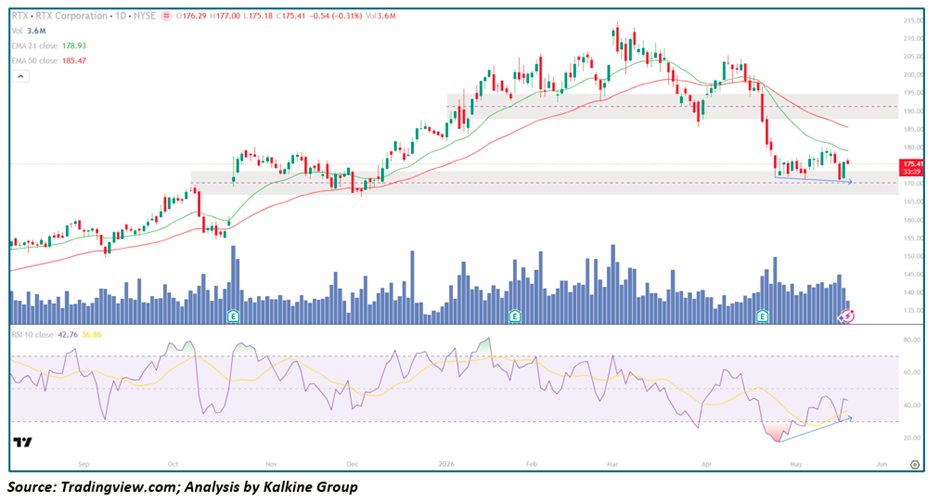
A prolonged consolidation within a defined range meets weakening downside momentum — mild bullish divergence forming, price below key moving averages, and strong horizontal support at $170 setting up a high-stakes decision zone.
Key Highlights
- RTX Corporation is currently trading near the lower end of its established range, stabilizing around the $170 support after repeated rejections near the $190 resistance zone
• The stock remains under pressure, trading below both the 21-period and 50-period moving averages — indicating short- to medium-term bearish structure
• A mild bullish divergence is emerging on momentum indicators, suggesting that selling pressure is gradually weakening
• Price is approaching a critical Demand zone around $170, which has historically acted as a strong support level
• Volume remains moderate, reflecting a lack of aggressive selling but also limited conviction from buyers
• The overall structure reflects consolidation rather than breakdown, with the potential for a base formation
Trend Structure: Range Consolidation After Weakness
RTX’s price action is currently defined by a broad consolidation range between $170 and $190, following a period of gradual downside pressure. The inability to sustain moves above $190 highlights strong Supply in that region, while repeated defenses of the $170 level confirm the presence of demand.
The stock is now trading closer to the lower boundary of this range, which makes the current zone particularly important. Unlike impulsive downtrends, the decline into support has been relatively controlled, suggesting that the move is corrective rather than a complete structural breakdown. This type of behavior often precedes either a Reversal or an extended consolidation phase.
The Critical Support Zone: $170 as the Line in the Sand
The $170 level represents a major technical support zone that has consistently attracted buyers. This area has acted as a demand base, preventing deeper declines and stabilizing price during previous tests.
A sustained hold above this level would reinforce the idea of accumulation and increase the probability of a rebound toward the upper range. However, a decisive breakdown below $170 could trigger accelerated downside movement, as the range structure would be invalidated and sellers gain control.
Moving Averages: Bearish Alignment with Recovery Potential
- 21-period Moving Average — currently above price and acting as immediate resistance
• 50-period moving average — also above price, reinforcing the bearish trend bias
Trading below both moving averages indicates that sellers remain in control in the short term. These levels are likely to act as dynamic resistance zones during any upward movement.
However, this configuration is typical during consolidation phases that follow a decline. A reclaim of the 21-period moving average would be the first signal of improving strength, while a move above the 50-period average would confirm a broader trend shift.
Momentum: Mild Bullish Divergence Emerging
Momentum indicators are beginning to show early signs of improvement. While price has been making lower lows or holding near lows, RSI and similar indicators are forming higher lows. This mild bullish divergence suggests that downside momentum is weakening.
Although not a strong reversal signal on its own, it often acts as an early warning that selling pressure is being absorbed. Confirmation through price action — such as a bounce from support or a breakout above resistance — is still required.
Volume Analysis: Controlled Participation
Volume remains moderate, which aligns with a consolidation phase. There is no evidence of panic selling or Capitulation, indicating that the current decline lacks aggressive bearish conviction.
At the same time, buying volume has not yet expanded significantly, suggesting that accumulation is gradual rather than aggressive. A meaningful increase in volume on upward moves would be required to confirm a breakout or sustained recovery.
Key Technical Levels and Scenarios
Resistance Levels
- $180–$185 — intermediate resistance zone within the range
• $190 — major resistance and range ceiling
Support Levels
- $170 — critical demand zone and range support
• Below $170 — opens the path to deeper downside
Scenario Analysis
- Bullish Reversal (Primary Watch)
If RTX holds above $170 and momentum continues to improve, the stock could attempt a move back toward $180–$190. A reclaim of the 21-period moving average would be the first signal, followed by a potential test of the range highs. - Continued Consolidation (Base Formation)
Price may continue to move between $170 and $190, allowing indicators to reset and forming a stronger base for a future breakout. This scenario would involve low Volatility and gradual stabilization. - Bearish Breakdown (Risk Case)
A break below $170 on increased volume would invalidate the range structure and likely trigger a deeper correction, as support fails and bearish momentum accelerates.
Conclusion: A Critical Decision Zone Near Support
RTX Corporation is currently positioned at a technically important level where support, momentum, and trend structure intersect. The presence of mild bullish divergence and controlled price action suggests that selling pressure is weakening, but the broader trend remains under pressure due to the position below key moving averages.
The $170 level stands as the defining support. Holding this level could lead to a recovery toward the upper range, while a breakdown would signal further downside risk. The next directional move will likely be determined by how price reacts at this key support zone and whether momentum continues to improve.


 Please wait processing your request...