
 CA
 NZ
 UK
 AU
 IND

 US

 Share
 X (Formerly Twitter)
 Whatsapp
 Facebook
 LinkedIn
 Telegram
 Email This Article
 Copy Link
 Summarize with AI
 Chat GPT
 Perplexity
KEY HIGHLIGHTS
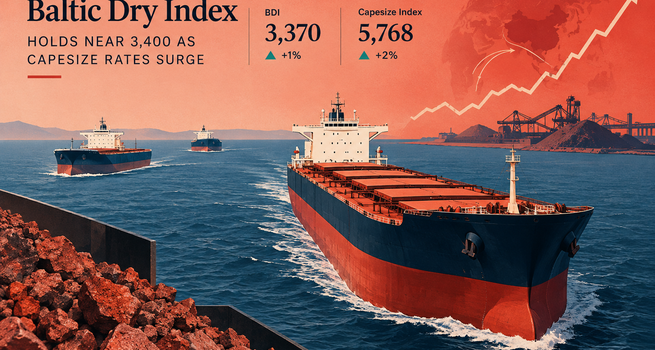
- The Baltic Dry index (BDI) rose for a second straight session on Friday, adding roughly 1% to close at 3,370 points, though the index still finished the week nearly 4% lower.
- The Capesize index jumped 2% to 5,768 points on strong iron-ore and coal demand, while the Panamax index extended its decline, down 1.4% to 2,251 points; Supramax edged up 0.3% to 1,767.
- At current levels the BDI is running roughly 21% higher over the past month and about 53% above year-ago levels, having touched a post-2021 high of around 3,628 in early September before easing back.
What the Baltic Dry Index Measures
The Baltic Dry Index is not a stock price or a Commodity quote. It is a daily freight-rate benchmark published by the Baltic Exchange in London, tracking how much it costs to charter dry bulk ships carrying raw materials such as iron ore, coal, grain, bauxite, cement and fertilisers. The index is a weighted composite of three vessel classes — Capesize, Panamax and Supramax — each covering a different cargo profile and trade route mix. A fourth class, Handysize, is tracked separately by the Baltic Exchange and does not feed into the headline BDI calculation.
|
Sub-index |
Ship type |
Typical cargo |
Weight in BDI |
|
Capesize (BCI) |
Biggest ships (~180,000 dwt) |
Iron ore, coal |
~40% |
|
Panamax (BPI) |
Medium-sized |
Coal, grain |
~30% |
|
Supramax (BSI) |
Smaller, geared vessels |
Grain, steel, minerals |
~30% |
Why the Index Matters to Markets
The BDI is closely watched because it functions as a leading indicator of industrial activity. Iron ore, coal and grain are inputs to steel production, power generation and food Supply chains, and shipments of these raw materials typically move well ahead of the finished goods they feed into. Because the index is built from real charter rates negotiated by shipbrokers rather than from surveys or estimates that get revised later, it is often viewed as harder to distort than many conventional economic statistics.
Capesize rates in particular serve as a rough proxy for Chinese steel demand, since the bulk of that segment's cargo is iron ore moving into China. The index also has a direct read-through to listed dry bulk shipowners such as Star Bulk, Golden Ocean and Genco, whose Earnings scale with prevailing charter rates. The index's Volatility is itself a caveat: a handful of extra vessels entering a route, or a short-term gap in available cargoes, can swing rates sharply in either direction, and elevated bunker fuel costs can compress owner profitability even when headline BDI levels look strong. The index also does not capture the container shipping market, which operates on a separate rate structure entirely.
Current Developments: Where the Index Stands
As of the most recent sessions, the BDI was quoted at approximately 3,370 points on Friday, 18 September 2026, with reports placing it near 3,399 points on Monday, 21 September. That represents a gain of roughly 21% over the trailing month and an increase of about 53% versus the same point a year earlier. The index had briefly touched approximately 3,628 points in early September — its highest level since late 2021 — before easing back over the following weeks.
The pullback was not uniform across vessel classes. Capesize rates have remained the standout performer, with daily earnings on that segment recently running in the $50,000–$52,000 per day range, a level that reflects a genuinely tight market rather than a speculative spike. Panamax has been the comparative laggard, weighed down by softer coal and grain volumes on the routes that segment typically serves.
Market participants commonly apply a rough framework when reading BDI levels: readings below roughly 1,000 points signal a weak freight market, levels around 2,000 are considered healthy, and readings of 3,000 or higher indicate a tight or strong market. By that yardstick, the index's current position in the mid-3,000s points to conditions that are historically firm rather than distressed, even after the recent weekly decline.
What Is Driving the Move
Supportive factors
- Longer average haul distances, as iron ore cargoes increasingly originate from Brazil, West Africa and Guinea rather than closer sourcing points, adding ton-miles of Demand even without a rise in total tonnage shipped.
- Route disruptions earlier in 2026 around chokepoints including the Strait of Hormuz, which rerouted some vessel capacity and tightened effective supply.
- Chinese steel mills building seaborne iron-ore inventory ahead of seasonal holiday periods.
- Fleet growth on certain key routes that has not kept pace with cargo demand, tightening the vessel-to-cargo balance.
Factors behind the mid-September pullback
- An imbalance of Capesize vessels positioned in the Pacific relative to prompt, loadable cargoes in that basin.
- Continued Panamax softness tied to coal and grain volumes.
- A degree of mean reversion typical after a sharp multi-week run-up in rates.
What to Watch Next
- Chinese steel output and the pace of iron-ore restocking into year-end.
- Loading volumes out of Brazil, Australia and Guinea, the principal seaborne iron-ore export origins.
- The Northern Hemisphere grain season, which primarily affects Panamax and Supramax demand.
- The balance of new dry bulk vessel deliveries against scrapping activity, which sets medium-term fleet capacity.
- Bunker fuel prices, since elevated fuel costs can erode shipowner margins even where headline freight rates remain elevated.
The Bottom Line
The Baltic Dry Index is, at its core, a price for moving raw materials by sea. Its current position near 3,400 points signals that the dry bulk freight market remains tight by historical standards, with that strength concentrated in the Capesize segment on the back of iron-ore and coal demand. The comparative softness in Panamax rates is a reminder that the headline index can mask meaningfully different conditions across vessel classes, and that the composite figure is best read alongside its underlying components rather than in isolation.
Is the Baltic Dry Index a reliable economic indicator?
It is widely used as one because it reflects actual charter transactions rather than estimates, and because dry bulk cargoes feed directly into industrial production. However, its short-term volatility means single-week or single-session moves are generally treated with more caution than sustained multi-week trends.
Why do Capesize and Panamax rates sometimes move in opposite directions?
The two segments serve different cargo bases and trade routes. Capesize is dominated by long-haul iron-ore and coal flows, chiefly into China, while Panamax carries a broader mix of coal and grain on medium-length routes. Regional supply-demand imbalances in one segment do not necessarily carry over to the other.
Does the Baltic Dry Index cover container shipping?
No. The BDI is limited to dry bulk carriers. Container shipping rates are tracked through separate benchmarks and are influenced by a different set of trade flows and contract structures.


 Nov 10, 2026





 Please wait processing your request...