
Gold (XAUUSD) is currently navigating a technically critical phase, with price action compressing within a well-defined descending triangle pattern while trading below key moving averages. This combination of structure, momentum, and trend alignment suggests that the market is approaching a decisive inflection point. With sellers gradually gaining control and support levels being repeatedly tested, the probability of a breakdown scenario is increasing, making the current setup one of the most important technical developments in gold in recent weeks.
Key Highlights
Key levels to watch
Several technical thresholds define the trading map from here.
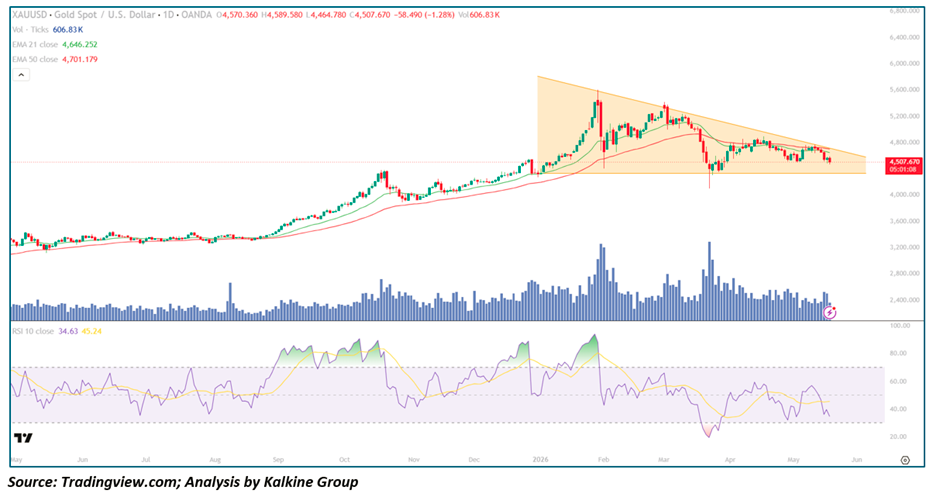
- Critical support: $4,450–$4,500. This horizontal band has absorbed multiple touches and is the spine of the descending triangle. Repeated tests have weakened its structural integrity, so a decisive daily close below this zone would carry high significance.
- Near-term resistance: $4,600–$4,650 (EMA-21). Rejections in this area have been common; any rally that stalls here is likely to invite fresh selling.
- Major overhead resistance: $4,700 (EMA-50). A break above this level would be the first step toward invalidating the bearish alignment.
- Measured downside targets on a confirmed breakdown: $4,300 first, then $4,100 as an extended target. These levels align with historical support clusters and are logical objectives if sellers extend control.
- Structural long-term support: $3,900. This is a deeper level that would only be targeted in an aggressive sell-off or in a broader regime shift.
Pattern Analysis: Descending Triangle and Market Psychology
The descending triangle visible on the chart is a classic representation of Supply overwhelming Demand over time. Unlike symmetrical triangles, where both buyers and sellers gradually converge, the descending triangle reflects a one-sided dynamic: sellers are becoming increasingly aggressive, stepping in at progressively lower price levels.
The structure begins with a strong peak near the $5,600–$5,700 zone, marking the exhaustion of the previous bullish phase. From there, each subsequent rally has produced a lower high — first near $5,300, then around $5,100, and later closer to $4,900. This consistent pattern of declining peaks clearly signals that buying strength is fading and that sellers are gaining confidence.
At the same time, the market has repeatedly found support in the $4,450–$4,500 zone, forming a horizontal base. However, rather than producing strong rebounds, each test of this level has resulted in weaker and shorter-lived bounces. This is a critical observation: repeated tests of support tend to weaken it, as buyers become exhausted and Liquidity at that level diminishes.
Currently, price is sitting almost exactly at this support zone, creating a high-pressure environment where a breakdown could trigger a sharp move lower. The narrowing price range between descending resistance and flat support indicates that the market is coiling, and such compression phases are typically followed by expansion — often in the direction of the prevailing trend, which in this case is turning bearish.
Moving Averages: From Support to Resistance
The behavior of moving averages provides additional confirmation of the bearish setup. The 21-day EMA, currently near $4,646, has transitioned from a support level during the earlier uptrend into a resistance barrier. Price attempts to reclaim this level have consistently failed, indicating that short-term momentum is firmly to the downside.
The 50-day EMA, around $4,701, represents a stronger and more significant resistance level. Its downward slope signals that the broader trend is also weakening. The widening gap between price and these moving averages further underscores the strength of the current bearish pressure.
Importantly, the alignment of these EMAs — with the 21 EMA below the 50 EMA and both trending downward — reflects a classic bearish configuration. In such environments, rallies toward these averages are often viewed as opportunities to initiate short positions rather than signs of recovery.
Momentum Analysis: Weakness Without Capitulation
The RSI reading near 34 provides valuable insight into the underlying momentum. While the indicator is approaching oversold territory, it has not yet reached extreme levels typically associated with capitulation or strong Reversal points. This suggests that the current move lower is orderly rather than panic-driven.
An orderly decline often indicates sustained selling pressure rather than a one-time event. If the descending triangle breaks to the downside, RSI is likely to move further into the 25–30 range, confirming acceleration in bearish momentum. Conversely, any bounce in RSI without a corresponding breakout above resistance would likely remain corrective in nature.
Key Technical Levels and Scenarios
The most critical level to watch is the $4,450–$4,500 support zone. This area has acted as the foundation of the current structure, and its integrity is essential for maintaining any bullish hope.
Resistance Levels:
- $4,600–$4,650: Immediate resistance around the 21 EMA
- $4,700: Major resistance at the 50 EMA
- $4,900: Previous structural resistance
Support Levels:
- $4,450–$4,500: Critical breakdown zone
- $4,300: First downside target
- $4,100: Secondary support level
- $3,900: Major long-term support
Scenario Analysis
- Bearish Breakdown (Primary Scenario)
A decisive break below $4,450, particularly on increased Volume, would confirm the descending triangle breakdown. This would likely trigger a move toward $4,300 initially, with potential extension toward $4,100. Momentum indicators would support this move, with RSI declining further into oversold territory. - Support Hold and Relief Rally
If support holds, gold could stage a short-term rebound toward $4,600 or even $4,700. However, given the broader bearish structure, such a move would likely represent a temporary relief rally rather than a trend reversal. Sellers are expected to re-enter near resistance zones. - Bullish Reversal (Low Probability)
For the bearish outlook to be invalidated, gold would need to break above $4,700 and reclaim both EMAs. This would also require a break of the descending Trendline, signaling a shift in market structure. At present, this scenario appears unlikely without a strong external catalyst.
Macro Context: Aligning Fundamentals with Technicals
The technical weakness in gold is being reinforced by Macroeconomic Factors. Rising U.S. Treasury yields continue to pressure gold, as higher yields increase the Opportunity cost of holding a non-yielding asset. Additionally, a relatively strong U.S. dollar further weighs on gold prices, given their inverse relationship.
Geopolitical tensions and Inflation concerns, which typically support gold, have not been sufficient to offset these pressures. Instead, the absence of panic-driven demand suggests that gold is currently lacking a strong bullish catalyst.
Conclusion: A Market on the Edge of Resolution
Gold is at a pivotal moment, with its price action tightly compressed within a bearish descending triangle and trading below key moving averages. The structure, momentum, and macro backdrop all point toward increasing downside risk.
The technical framework is clear:
- A break below $4,450 would confirm a bearish continuation toward $4,100
- A move above $4,700 would invalidate the bearish setup
Until one of these levels is decisively breached, the market remains in a consolidation phase. However, given the weight of evidence, the balance of probabilities favors a downside resolution.
One-Line Takeaway:
Gold is coiling within a bearish descending triangle under declining EMAs — a breakdown below $4,450 could trigger the next significant leg lower, while rallies remain corrective unless key resistance levels are reclaimed.


 Please wait processing your request...