
 CA
 NZ
 UK
 AU
 IND

 US

 Share
 X (Formerly Twitter)
 Whatsapp
 Facebook
 LinkedIn
 Telegram
 Email This Article
 Copy Link
 Summarize with AI
 Chat GPT
 Perplexity

Key Highlights
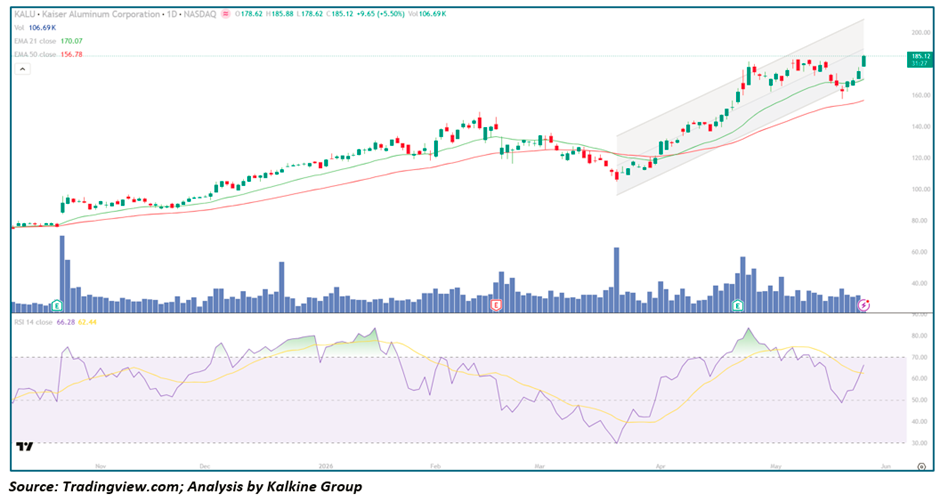
- KALU closed at $185.12, surging +$9.65 (+5.50%) in a powerful breakout continuation session pushing price toward the upper boundary of its rising channel
- Price traded between $178.62 and $185.88 intraday, closing near the session high — confirming sustained institutional buying throughout the day
- The stock is trading comfortably above both the EMA-21 ($170.07) and EMA-50 ($156.78), confirming a firmly bullish trend structure with both averages rising steeply
- RSI-14 at 66.28 with signal at 62.44 — building constructively toward overbought territory with the main line above the signal line, confirming a fresh and active bullish crossover
- Volume at 106.69K was supportive and consistent, reflecting steady institutional participation behind the advance
- KALU has rallied from below $110 in March to above $185 — a gain of over 68% in approximately 12 weeks — making it one of the strongest performers in the industrial metals space
Trend Structure: From Measured Uptrend to Parabolic Channel Leadership
Kaiser Aluminum's chart tells a story of two distinct phases separated by a sharp but ultimately constructive corrective reset in February and March 2026.
The first phase — running from November 2025 through late January 2026 — was a measured, orderly uptrend. Price advanced steadily from the $80 zone toward $140, with both EMAs rising in disciplined bullish alignment beneath price and RSI oscillating between 55 and 75 in a healthy trending pattern. Three Earnings events punctuated the advance, each producing elevated volume and confirming that institutional participants were actively repositioning into the stock. This was not a speculative drift — it was a methodical re-rating of an aluminum producer benefiting from Supply constraints and improving industrial Demand.
The second phase began after a sharp corrective reset in February and March. A significant Reversal from the $140 highs drove price back toward the $108–$110 zone, RSI collapsed toward 30 — its most oversold reading on the entire chart — and the EMA-21 was decisively breached. For those without conviction in the broader thesis, this looked like a trend reversal. It was not. Price found its footing at the lower boundary of what would become the defining technical structure of the current advance — the rising channel — and the recovery that followed has been one of the most powerful moves on the chart.
From the March low, KALU has advanced within a clearly defined rising channel bounded by two ascending grey trendlines. The channel structure has been respected with remarkable consistency — pullbacks to the lower boundary have attracted buyers, advances toward the upper boundary have prompted brief consolidations, and the overall trajectory has been relentlessly higher. Today's session pushes price decisively toward the upper channel boundary near $186–$188, with the close at $185.12 representing the strongest single-day advance since the channel breakout began.
Moving Averages: Maximum Bullish Configuration
The EMA-21 at $170.07 is rising at its steepest angle since the initial November uptrend phase, sitting approximately 9% below current price. It has acted as reliable dynamic support on every meaningful pullback within the channel advance and remains the primary reference level for momentum traders managing active positions. A return to this level on any corrective session would be entirely healthy and represent a high-quality re-entry opportunity within the broader trend.
The EMA-50 at $156.78 has turned steeply higher after the brief flattening caused by the February–March correction, now sitting approximately 16% below current price. The widening gap between EMA-21 and EMA-50 — currently over $13 and expanding — is a powerful confirmation that trend velocity is accelerating rather than decelerating. The bullish stack of price above EMA-21 above EMA-50, with both rising steeply, is the cleanest trend configuration the chart has produced across its entire history.
Momentum and Volume: RSI Approaching Overbought With Room to Run
RSI-14 at 66.28 is advancing toward but not yet in overbought territory — a constructive configuration that mirrors the mid-advance positioning seen during the strongest phase of the November–January uptrend, just before RSI pushed above 70. The fresh bullish crossover of the main line above the signal line at 62.44 aligns precisely with today's price breakout, providing timing confirmation that adds conviction to the technical signal. Traders should monitor for RSI reaching the 70–75 zone, where the pace of advance has historically moderated in this chart.
Volume at 106.69K is consistent and supportive, representing above-average participation for a stock of KALU's typical daily activity profile. The volume structure throughout the channel advance has been exemplary — elevated on breakout sessions, lighter on pullback days, with no heavy-volume reversal sessions indicating distribution.
Key Levels and Framework
Resistance: $186–$188 upper channel boundary, $190–$192 psychological resistance, $200 major target. Support: EMA-21 at $170.07, lower channel boundary near $165, EMA-50 at $156.78.
- Above $186–$188 → channel breakout confirmed, target $190–$200
- Above $190 → psychological breakout, momentum expansion toward $200 opens
- Below EMA-21 at $170.07 → near-term caution, monitor for distribution
- Below EMA-50 at $156.78 → broader thesis under review
For momentum traders, KALU is a high-conviction channel advance with RSI positioned for further expansion — one of the strongest charts in the industrial metals space right now.


 Oct 27, 2026





 Please wait processing your request...