
A Fibonacci-Driven Breakout with Unfinished Business Above
Key Highlights
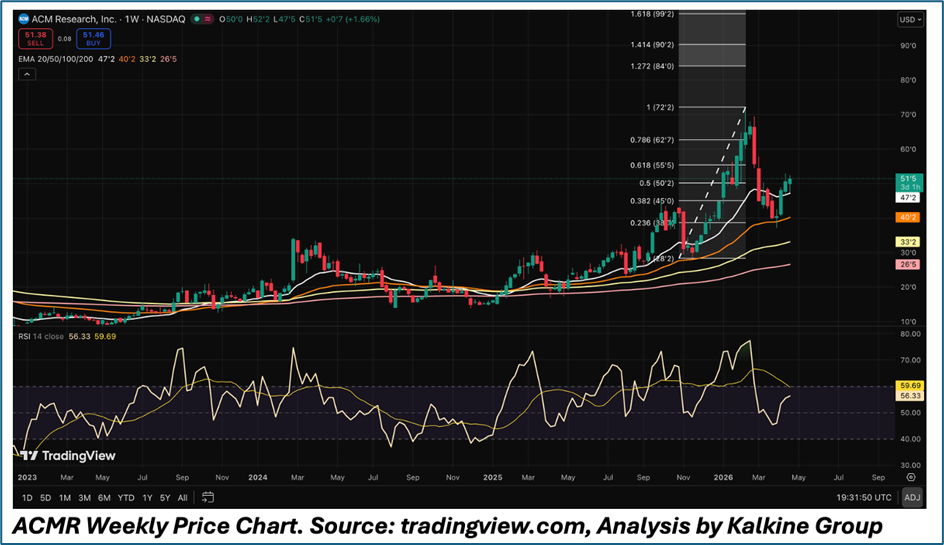
- ACMR rallied precisely to the 1.0 Fibonacci extension at $72 before pulling back, confirming the Fibonacci grid's validity.
- Pullback found strong support at the 0.5 Fibonacci level and 20-week EMA (~$47–$50), keeping the broader uptrend intact.
- All four EMAs remain bullishly stacked, with the 50-week and 100-week EMAs never threatened during the correction.
- RSI reset to ~56 from overbought highs without touching oversold — a healthy momentum consolidation signaling continuation potential.
- Next upside targets sit at the 1.272 and 1.414 Fibonacci extensions of $84–$90, with $47 as the key invalidation level.
ACM Research, Inc. (NASDAQ: ACMR) is printing one of the more technically compelling setups in the semiconductor equipment space right now. The weekly chart tells a story of a multi-year base breakout, a parabolic extension into Fibonacci extension territory, a sharp but orderly mean-reversion pullback, and now — critically — a nascent re-accumulation phase that deserves serious attention from both momentum and swing trading desks.
Let's break it down layer by layer.
The Base and the Breakout
From mid-2023 through most of 2024, ACMR traded in a relatively compressed range, oscillating between roughly $15 and $45 while all four EMAs (20, 50, 100, 200) remained tightly stacked — a textbook coiling structure. Volume was indifferent, price action was choppy, and the stock was largely ignored by the tape. That changed decisively heading into late 2024 and accelerating through early 2026, when ACMR staged a powerful multi-week rally that carried it from the low-$30s all the way into the high-$60s and briefly touching the $72 region — the 1.0 Fibonacci extension level mapped on the chart.
The character of that move was important. Price broke cleanly above all four EMAs in sequence, the moving averages fanned out bullishly, and the slope of the advance was steep enough to suggest institutional accumulation rather than retail-driven speculation. This was not a meme-stock squeeze — it was a structured, trend-following move with genuine participation.
The Fibonacci Map — Where the Chart Speaks Clearly
The Fibonacci extension grid overlaid on this chart is the analytical backbone of the entire setup, and it's remarkably clean. Key levels are:
- 0.236 (~$33) — acted as the launch pad for the initial acceleration phase
- 0.382 (~$45) — provided brief consolidation before continuation
- 0.5 (~$50) — a psychologically and technically significant midpoint
- 0.618 (~$55) — the classic golden ratio level, which capped the first push
- 0.786 (~$63) — where the stock found resistance before the final blow-off
- 1.0 (~$72) — the full extension target, tagged precisely at the February 2026 peak
- 1.272 (~$84) and 1.414 (~$90) — the next extension targets if the bull case reasserts
The fact that the stock reversed almost to the tick at the 1.0 extension ($72) before pulling back sharply is not coincidence — it is the market respecting a well-defined technical level. This kind of precision lends credibility to the entire Fibonacci framework and means the upper extension levels at $84 and $90 should be taken seriously as forward targets if price can reclaim key support.
The Pullback — Healthy or Concerning?
The sharp red candles from the $72 peak down to the mid-$40s initially looked alarming, but context matters. The pullback found its footing precisely around the 0.5 retracement level near $50 and the 20-week EMA at approximately $47 — two layers of structural support converging at the same price zone. That is not a broken stock. That is a stock digesting gains in an orderly fashion before its next leg.
Equally important: the 50-week EMA ($40) and 100-week EMA ($33) never came into play during the correction. The fact that dip buyers emerged well above these longer-duration averages suggests the trend remains structurally intact. Longer-term holders did not capitulate — they added.
RSI — The Momentum Confirmation
The 14-week RSI currently sits at 56.26 (close) with the signal line at 59.69 — comfortably in bullish territory but nowhere near overbought. This is the sweet spot for trend continuation setups. During the parabolic phase into $72, the RSI pushed into the high 70s, which flagged the exhaustion before the reversal. The fact that RSI has now reset to the mid-50s without touching oversold territory confirms this was a momentum reset, not a trend reversal. Historically, RSI re-entries into the 60–70 band from this configuration have preceded significant continuation moves.
The Trade Setup
Current price at $51.49 sits just above the 0.5 Fibonacci level and is holding the 20-week EMA. The structure argues for a long bias with a defined risk level. A weekly close below $47 (20-week EMA) would invalidate the near-term bullish thesis and warrant reassessment. On the upside, a reclaim of $55–63 opens the path toward the 1.272 extension at $84 — a potential 63% move from current levels.
The risk-reward here is asymmetric. The chart is not broken. The trend is not over.
Watch the $55 level closely. That is where this trade either confirms or stalls.
This is a technical analysis piece intended for informational purposes only and does not constitute investment advice


 Please wait processing your request...