
Key Highlights
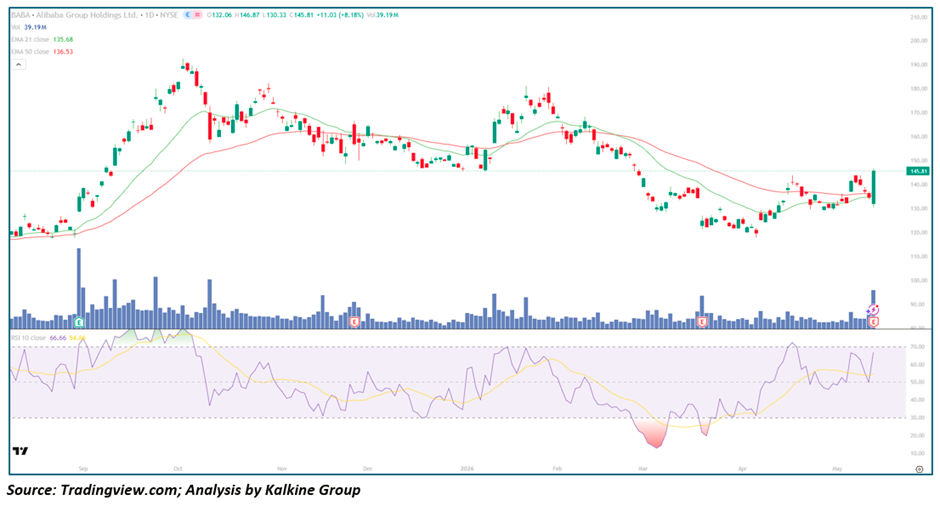
- Alibaba Group Holding Ltd. (NYSE:BABA) is trading at $145.81, up +$11.03 (+8.18%), showing a strong bullish session after a period of base formation
• Price has reclaimed the EMA-21 ($135.68) decisively and is now approaching the EMA-50 ($136.53) zone from below, signaling improving short-term structure
• The recent surge comes with a notable Volume spike (~39.19M), indicating strong participation and potential accumulation
• RSI-10 at 66.66, with signal near 54.66 — momentum has turned bullish and is approaching overbought territory
• The stock is attempting to break out from a multi-week consolidation base between $125–$140, shifting near-term bias to bullish
Trend Structure: Base Formation Transitioning into Early Recovery
Alibaba has undergone a prolonged corrective phase since its late-2025 highs near $190, followed by a steady downtrend that bottomed out around the $120–$125 zone in March 2026. This phase was marked by persistent lower highs and weak momentum, reflecting sustained selling pressure and lack of conviction from buyers.
However, the recent price action suggests a structural shift. The stock has formed a base with higher lows from March through May, indicating gradual accumulation. The latest breakout attempt above the $140–$145 range signals the early stages of a trend Reversal or recovery phase, although confirmation is still pending as price approaches overhead resistance.
Price Action: Strong Breakout Attempt Above $145 Signals Bullish Intent
The most significant development in the current session is the strong bullish candle with high volume, pushing price above recent consolidation highs near $140. This move indicates aggressive buying interest and suggests that bulls are attempting to regain control after weeks of sideways movement.
The $145–$150 zone now acts as immediate resistance, aligning with prior breakdown levels and Supply zones from April. A sustained close above this region would confirm a breakout and potentially trigger a momentum-driven rally toward $155–$160.
However, failure to hold above $140–$142 on a closing basis could result in a pullback, keeping the stock range-bound within the prior consolidation structure.
Moving Averages: EMA Reclaim Signals Structural Improvement
The Moving Average structure is beginning to improve:
- EMA-21 ($135.68) has been reclaimed decisively — a key short-term bullish signal
• EMA-50 ($136.53) is flattening and now being challenged, marking a critical inflection point
• The narrowing gap between the EMAs suggests a potential bullish crossover (golden cross) in the near term
Holding above the EMA-21 on pullbacks will be crucial. A successful retest of the $135–$138 zone would reinforce the bullish structure and confirm a transition from consolidation to trend reversal.
Momentum Indicators: RSI Strengthening Toward Bullish Territory
The RSI-10 at 66.66 reflects strong upward momentum following the recent breakout attempt. The RSI has moved above its signal line and is approaching the overbought threshold near 70 — a sign of increasing bullish strength.
Importantly, RSI has formed higher lows since March, indicating improving momentum conditions. A brief consolidation or pullback toward RSI 55–60 would be healthy and could set up the next leg higher.
Volume Analysis: Breakout Supported by Strong Participation
Volume has expanded significantly during the latest upward move, with ~39M shares traded, marking one of the strongest participation days in recent weeks. This surge in volume suggests institutional involvement or aggressive accumulation, lending credibility to the breakout attempt.
The absence of heavy selling volume during prior pullbacks also supports the view that the recent consolidation phase was more accumulative than distributive.
Key Technical Levels and Scenarios
Resistance Levels
- $145–$150 — Immediate resistance and breakout zone
• $155–$160 — Next upside target (prior consolidation region)
• $170–$175 — Major resistance from earlier 2026 highs
Support Levels
- $135.68 — EMA-21 (critical short-term support)
• $130–$132 — Recent consolidation base
• $120–$125 — Major structural support
Scenarios
- Bullish Continuation (Primary Case) — Price holds above $140–$142, breaks decisively above $150 on volume, and extends toward $155–$160 as momentum builds.
- Consolidation (Secondary Case) — Stock ranges between $135–$150 as it digests recent gains, forming a higher base before the next directional move.
- Bearish Rejection (Low Probability) — Failure to sustain above EMA-21 leads to a breakdown below $135, bringing the $125 support zone back into focus.
Conclusion: Momentum Shift Underway as Alibaba Tests Key Resistance
Alibaba’s technical structure is showing meaningful improvement, transitioning from a prolonged downtrend into a potential recovery phase supported by rising momentum, strong volume, and reclaiming key moving averages. The breakout attempt above the $140–$145 zone is a critical development, signaling renewed buyer interest.
However, the stock now faces a decisive test at the $145–$150 resistance band. A confirmed breakout above this level would mark a clear trend reversal and open the path for further upside, while failure to hold gains could result in continued consolidation.
For now, the setup remains constructively bullish, with dips toward the EMA-21 likely to be viewed as buying opportunities as long as the improving structure remains intact.


 Please wait processing your request...