_04_07_2026_21_20_21_582362.jpg)
Key Highlights
- Amazon.com Inc. is struggling below key moving averages, indicating weakening momentum
• Price recently broke lower and is now consolidating beneath resistance
• Repeated rejection near the 50-day moving average signals selling pressure
• RSI near the midpoint reflects indecision with a slight bearish tilt
• Key horizontal support near $210–$212 is under pressure
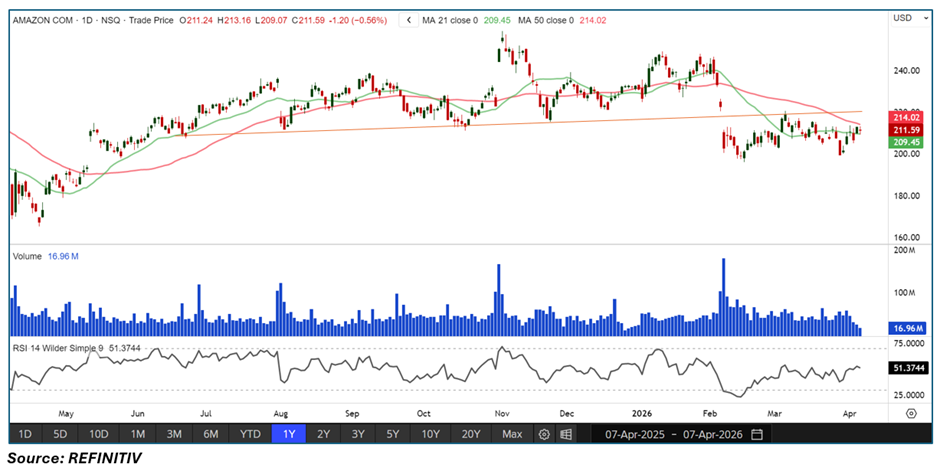
Trend Structure: Breakdown Followed by Weak Consolidation
Amazon’s broader trend shows a loss of upward momentum after failing to sustain higher levels near recent highs. The stock has transitioned into:
• A sideways-to-bearish structure
• Lower highs forming after the pullback
• Weak follow-through on recovery attempts
This suggests the prior uptrend is weakening, with sellers beginning to gain control.
Price Action: Rejection Signals Supply Overhang
Recent price behavior highlights:
• A sharp drop followed by tight consolidation
• Multiple failed attempts to reclaim higher levels
• Candles showing hesitation and limited upside strength
This type of structure typically reflects:
• Supply dominance near resistance zones
• Lack of conviction from buyers
• Increased likelihood of another leg lower
RSI Momentum: Neutral Zone with Bearish Lean
The 14-period RSI is around 51, slightly above the midpoint:
• Indicates neutral momentum with no strong trend
• Fails to confirm bullish strength despite consolidation
• Suggests market indecision, often preceding a directional move
Given the price structure, RSI leans slightly bearish unless it pushes higher decisively.
Moving Average Analysis: Resistance Capping Upside
Key moving averages are acting as barriers:
• 21-day MA (~209.45) closely aligned with current price, offering limited support
• 50-day MA (~214.02) acting as strong overhead resistance
Key observations:
• Price remains below the 50-day MA
• Attempts to break above it have failed
• The flattening 21-day MA reflects loss of short-term momentum
This setup reinforces a resistance-heavy structure.
Support Levels: Key Floor Under Pressure
Amazon is currently testing an important support zone:
• $210–$212 region acting as near-term support
• Price repeatedly revisiting this level
• Increased testing weakens support over time
A confirmed breakdown below this zone could:
• Trigger further downside momentum
• Open the path toward lower support levels
Market Structure: Range Breakdown Risk Developing
The broader structure reflects:
• A transition from uptrend to range-bound consolidation
• Increasing pressure on support
• Lack of strong bullish continuation
This environment often precedes:
• Either a breakdown continuation
• Or a volatility expansion phase
Currently, the bias leans bearish.
Key Technical Scenarios
- Bearish Breakdown (Primary Scenario)
If support fails:
• Price may break below $210
• Selling pressure could accelerate
• Downside targets may emerge toward lower demand zones - Range-Bound Consolidation
If support holds temporarily:
• Price may remain between ~$210–$214
• RSI likely to hover near midpoint
• Market builds energy for next move - Bullish Recovery Attempt
If buyers regain control:
• Break above $214 (50-day MA) could trigger upside
• Momentum may shift back to bullish
• Requires strong volume and follow-through
Risk Considerations
- Multiple support tests increase breakdown probability
• RSI neutrality allows for sudden directional shifts
• False breakdowns or rebounds are possible
• Broader market sentiment may heavily influence price action
Conclusion: Amazon Faces Mounting Pressure Below Resistance
Amazon.com Inc. (NASDAQ: AMZN) is showing signs of weakening momentum, with price capped below key moving averages and support levels being repeatedly tested. While consolidation persists, the balance of evidence points toward a developing bearish bias.
Unless the stock reclaims higher resistance levels, particularly the 50-day moving average, the risk of downside continuation remains elevated in the near term.


 Please wait processing your request...