_04_08_2026_20_44_03_311599.jpg)
Key Highlights
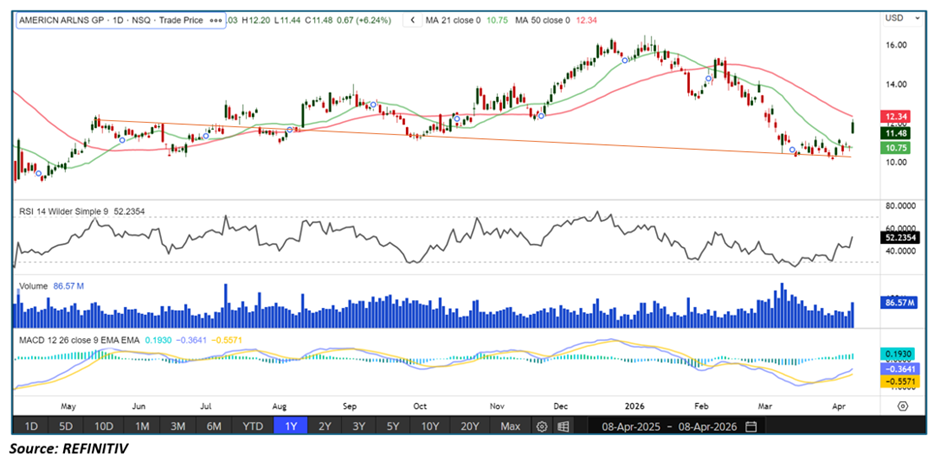
• American Airlines Group Inc. (AAL) has taken support at a long-term falling trendline, signaling a potential reversal zone
• Price has rebounded sharply with strong volume, indicating renewed buying interest
• The stock has reclaimed the 21-period SMA, suggesting improving short-term momentum
• The 14-period RSI has reversed from oversold levels, pointing to strengthening momentum
• Immediate resistance is seen near the 50-period SMA, while support holds near the trendline zone
Trend Structure: Long-Term Trendline Support Holds Firm
American Airlines’ broader trend had been under pressure, with the stock forming lower highs over recent months. However, the recent price action highlights a critical technical development—the stock has successfully taken support at a long-term falling trendline.
This trendline has acted as a key structural support, and the bounce from this level suggests that selling pressure is fading. Such reactions often mark important inflection points where the trend may shift from bearish to neutral or even bullish over time.
If the stock continues to respect this support, it could form the base for a broader recovery phase.
Price Action: Strong Bounce Backed by Volume
AAL has witnessed a notable rebound from its recent lows, with price action supported by a visible increase in trading volumes. This is a critical signal, as volume-backed moves tend to carry more conviction.
Key observations:
• Sharp rebound from trendline support
• Strong bullish candles indicating aggressive buying
• Sustained move higher without immediate rejection
The presence of strong volume suggests institutional participation, which often strengthens the durability of the move. This type of price behavior is typically seen during the early stages of a recovery.
RSI Momentum: Reversal from Oversold Territory
The Relative Strength Index (RSI) has shown a meaningful reversal after dipping into oversold territory (below 30). This is often an early indication that downside momentum is exhausted.
Current RSI signals:
• Rebound from oversold levels
• Move back toward the midpoint (50)
• Momentum shifting from bearish to neutral/bullish
Such reversals often precede short-term rallies or broader recovery phases. If RSI continues to move higher and sustains above the midpoint, it would further confirm strengthening bullish momentum.
Moving Average Analysis: Reclaiming 21-SMA Signals Strength
A key technical improvement in AAL’s setup is the reclaiming of the 21-period simple moving average (SMA).
- 21-period SMA: Now acting as short-term support
• 50-period SMA: Acting as immediate resistance
• Broader trend: Still in transition phase
Reclaiming the 21-SMA is often an early signal that buyers are regaining control in the short term. If the stock manages to sustain above this level, it could pave the way for a move toward the 50-SMA.
A breakout above the 50-period SMA would be a stronger confirmation of trend reversal and could accelerate upside momentum.
MACD Indicator: Early Signs of Positive Shift
The MACD indicator is beginning to show signs of improvement, aligning with the broader recovery narrative.
- MACD lines are converging
• Histogram is narrowing toward positive territory
• Momentum is gradually shifting in favor of buyers
While not fully bullish yet, the improving MACD setup suggests that downside momentum is fading and a bullish crossover could be on the horizon.
Market Structure: Recovery Phase Emerging
The current structure indicates that AAL may be transitioning from a downtrend into a recovery phase. This phase is typically characterized by:
- Strong rebounds from key support levels
• Improving momentum indicators
• Gradual shift in sentiment
While the stock has not yet fully confirmed a long-term uptrend, the combination of trendline support, volume strength, and improving indicators suggests that a base may be forming.
ey Technical Levels & Targets
- Immediate Resistance: Near $12.30–$12.50 (50-period SMA)
• Next Upside Target: $13.50–$14.50 range
• Immediate Support: Around $10.50–$10.80 (trendline & 21-SMA zone)
• Strong Support: Near recent swing lows
A sustained move above the $12.50 level could trigger a stronger rally toward the $13.50–$14.50 zone.
Key Technical Scenarios
- Continued Recovery (Primary Scenario)
• Price holds above 21-SMA
• RSI continues trending higher
• Volume remains supportive
• Stock moves toward 50-SMA and beyond - Breakout Confirmation
• Price clears 50-period SMA
• Momentum accelerates
• Strong upside continuation toward $14+ - Pullback to Support
• Price retraces toward trendline support
• 21-SMA tested as support
• Recovery delayed but structure intact
Risk Considerations
- Failure to hold above the 21-SMA could weaken momentum
• Rejection at the 50-SMA may cap near-term upside
• Broader market volatility could impact recovery
• Lack of follow-through volume may reduce conviction
Conclusion: Support-Led Bounce Signals Improving Outlook
American Airlines has staged a strong rebound after finding support at a long-term falling trendline. The move is reinforced by strong volume, a reversal in RSI from oversold levels, and the reclaiming of the 21-period SMA.
These developments point to a shift in short-term sentiment, with early signs of a recovery phase emerging. While further confirmation is needed—particularly a break above the 50-period SMA—the current setup suggests a cautiously bullish outlook.
If momentum sustains, AAL could extend its recovery and target higher resistance levels in the near term.


 Please wait processing your request...