
Key Highlights
- American Express Company (NYSE: AXP) has taken support at a key trendline support level, signaling a potential recovery zone
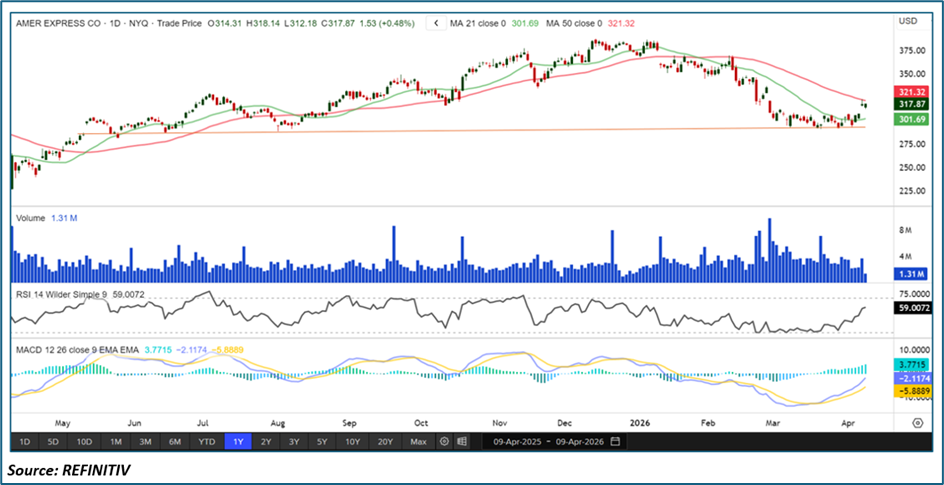
• Price has rebounded from support but faces layered resistance near previous swing highs
• The stock is trading above the 21-period SMA but below the 50-period SMA, indicating improving short-term momentum within a broader cautious structure
• The 14-period RSI is in positive territory, reflecting strengthening momentum
• The MACD histogram is positive, signaling improving bullish momentum
Trend Structure: Trendline Support Holds Firm
American Express has recently tested and respected a key upward-sloping trendline support, which has historically acted as a strong demand zone. The successful defense of this level suggests that buyers are stepping in to protect the broader structure.
This development indicates:
• Selling pressure weakening near support
• Buyers regaining short-term control
• Potential formation of a higher low
However, despite the bounce, the broader structure still reflects caution due to overhead resistance levels that may cap upside in the near term.
Price Action: Recovery Faces Layered Resistance
AXP has shown a constructive rebound after bouncing from trendline support. The price action reflects improving sentiment, but the upside path is not entirely clear due to multiple resistance zones.
Key observations:
• Strong reaction from support zone
• Gradual formation of higher lows
• Price approaching previous swing highs
These previous swing highs act as layered resistance, meaning that price may face selling pressure at multiple levels as it attempts to move higher. A decisive break above these zones is required to confirm sustained bullish momentum.
Moving Average Analysis: Short-Term Strength, Medium-Term Hurdle
The moving average setup highlights a mixed trend environment:
- 21-period SMA: Price trading above, acting as immediate support
• 50-period SMA: Positioned above price, acting as key resistance
• Trend implication: Short-term recovery within a broader neutral-to-bearish structure
Holding above the 21-SMA suggests that near-term momentum is improving, while the 50-SMA overhead remains a critical barrier for confirming a stronger trend reversal.
A sustained move above the 50-period SMA would significantly improve the technical outlook.
RSI Momentum: Positive Territory Indicates Strength
The Relative Strength Index (RSI) is currently positioned in positive territory above the 50 level, indicating strengthening momentum.
Current RSI signals:
• Sustained above midpoint (50)
• Upward bias reflecting increasing buying pressure
• Momentum shifting in favor of bulls
This suggests that buyers are gradually gaining control, supporting the ongoing recovery phase.
MACD Indicator: Histogram Turns Positive
The MACD indicator is reinforcing the improving momentum outlook, with the histogram in positive territory.
Key signals:
• MACD histogram above zero line
• Increasing positive bars indicating momentum pickup
• Early bullish momentum formation
This setup suggests that short-term momentum is accelerating, increasing the likelihood of further upside attempts.
Market Structure: Recovery Phase with Resistance Overhang
The overall structure in AXP indicates a recovery phase following a support bounce, characterized by:
• Strong reaction from trendline support
• Improving technical indicators
• Gradual move toward resistance zones
However, the presence of layered resistance near previous highs suggests that the recovery may face intermittent pauses or pullbacks before establishing a clear uptrend.
Key Technical Levels & Targets
- Immediate Resistance: Previous swing highs (layered resistance zone)
• Next Upside Target: Break above resistance could open further upside
• Immediate Support: 21-period SMA
• Strong Support: Trendline support zone
A sustained move above both the resistance zones and the 50-SMA would be key for confirming a bullish continuation.
Key Technical Scenarios
- Gradual Recovery (Primary Scenario)
- Price holds above 21-SMA
• RSI remains above 50
• MACD histogram stays positive
• Price tests layered resistance levels
- Breakout Scenario
- Price clears previous swing highs
• Moves above 50-SMA
• Momentum accelerates toward higher levels
- Rejection at Resistance
- Price fails to break resistance
• Pullback toward 21-SMA
• Trendline support remains intact
Risk Considerations
- Failure to hold above the 21-SMA could weaken momentum
• Strong resistance at prior highs may cap upside
• Rejection below the 50-SMA may delay recovery
• Broader market volatility could impact price action
Conclusion: Support-Led Bounce Meets Overhead Resistance
American Express has shown a constructive rebound after taking support at a key trendline level, supported by improving momentum indicators such as RSI and MACD histogram turning positive.
While trading above the 21-period SMA reflects strengthening short-term momentum, the presence of layered resistance and the 50-period SMA overhead suggests that the stock still faces important hurdles.
If AXP manages to break above these resistance levels, it could confirm a stronger bullish continuation. Until then, the stock remains in a recovery phase with a cautiously optimistic outlook.


 Please wait processing your request...