
Artificial Intelligence Infrastructure Boom Drives Extraordinary Returns Across Storage, Semiconductor, and Optical Networking Sectors
The Market Context: An Unprecedented Technology Rally
The first five months of 2026 have witnessed one of the most concentrated periods of Equity appreciation in semiconductor and technology infrastructure history. Five stocks—SanDisk Corporation, Intel Corporation, Seagate Technology, Western Digital, and Lumentum Holdings—have delivered returns ranging from 177% to 533% year-to-date, substantially outperforming the broader market and even the high-flying semiconductor index. This performance represents not merely a cyclical recovery from 2022-2023 industry lows but rather a fundamental repricing of companies positioned at the intersection of artificial intelligence infrastructure deployment and data storage capacity expansion.
The common thread connecting these disparate businesses—flash memory, hard disk drives, semiconductor Manufacturing, and optical components—is their critical role in AI compute infrastructure. Training large language models requires exponential increases in storage capacity, high-bandwidth interconnects, and computational horsepower. A single GPT-4 scale model training run can consume 500-1,000 petabytes of storage and require optical interconnects capable of moving data at terabits per second between thousands of GPUs. This structural Demand shift has transformed what were previously considered mature, cyclical businesses into strategic bottlenecks commanding premium valuations and exceptional profitability.
What makes the 2026 rally particularly notable is its divergence from historical technology boom patterns. Unlike the 1999-2000 internet Bubble or even the 2020-2021 Pandemic-driven technology surge, current valuations are anchored to genuine Revenue growth and expanding profit margins rather than speculative narratives. The five stocks examined in this analysis collectively generate over USD 100 billion in annual revenue and, with one notable exception, demonstrate positive and accelerating Earnings growth. This fundamental underpinning distinguishes the current advance from prior euphoric periods, though it does not eliminate the risk of correction if growth expectations prove overly optimistic.
SanDisk Corporation: The Runaway Leader at +533% YTD
Fundamental Profile and Financial Performance
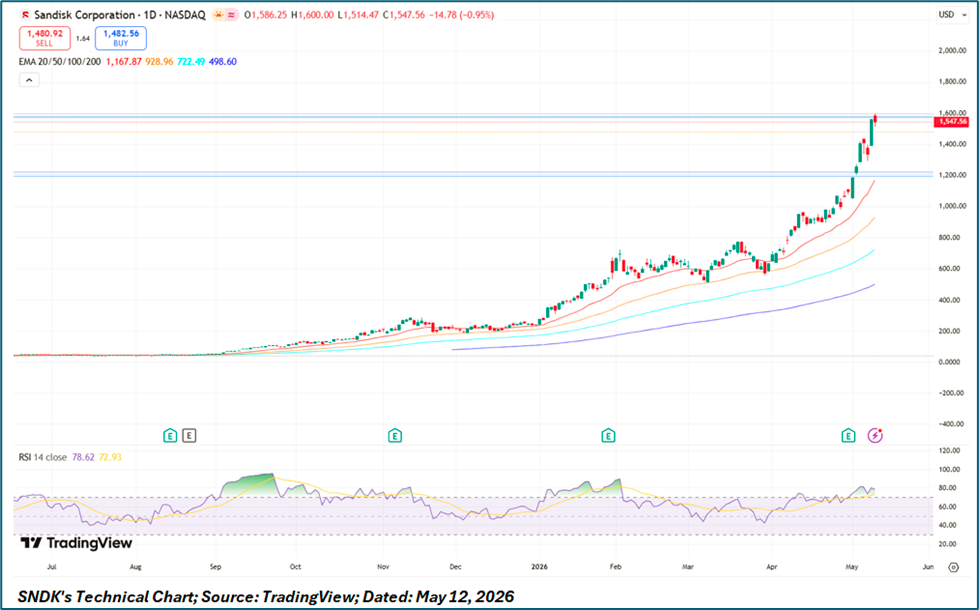
SanDisk Corporation has emerged as the undisputed performance leader, delivering a staggering 533% year-to-date return that has elevated its market Capitalization to USD 229.18 billion. At USD 1,547.56 per share, the stock trades at 53.80x trailing earnings—a premium multiple that reflects both current profitability and market conviction that AI-driven storage demand represents a structural rather than cyclical opportunity. The company's financial metrics are exceptional across virtually every dimension: gross Margin of 56.04% significantly exceeds NAND industry norms, Operating Margin of 41.58% rivals the profitability of software companies, and net margin of 34.19% demonstrates pricing power and operational excellence. Free Cash Flow margin of 33.83% is extraordinary for a Capital-intensive semiconductor Business, while Assets/">Return on Assets of 30.01% and Return on Equity of 39.30% place SanDisk among the most capital-efficient technology enterprises globally.
The performance surge reflects SanDisk's dominant positioning in enterprise solid-state drives, where the company has captured disproportionate share of AI infrastructure storage deployments. Hyperscale cloud operators building out AI training clusters require massive quantities of high-performance flash storage—a single large language model training run can utilize 500-1,000 petabytes of PCIe Gen5 NVMe drives, creating demand that has overwhelmed industry Supply. SanDisk's technology Leadership in high-layer 3D NAND (currently shipping 200+ layer products) enables superior cost-per-bit Economics that translate to either margin advantages or the ability to underprice competitors while maintaining profitability. The company's vertical integration strategy—designing proprietary controllers and firmware in addition to manufacturing NAND chips—allows product differentiation and value capture at multiple points in the storage value chain.
Technical Analysis
SanDisk's technical chart displays one of the most powerful and extended bull markets in modern semiconductor history, with price action that has advanced essentially uninterrupted from USD 300 in mid-2025 to USD 1,547.56—a 416% gain that has unfolded with minimal meaningful corrections. The rally has been characterized by persistent strength above all key moving averages, with the 20-day EMA currently near USD 928, the 50-day near USD 498, the 100-day near USD 493, and the 200-day near USD 499, creating an extraordinarily steep upward staircase that defines one of the strongest primary uptrends in equity market history. The stock has essentially never tested these moving averages during the entire ten-month advance, remaining in a continuous state of parabolic momentum that has rewarded buyers at virtually every entry point. The RSI oscillator registers approximately 78 on the daily timeframe—persistently overbought but not yet at extreme levels, as RSI can remain elevated for extended periods during powerful trends. Volume analysis reveals consistent accumulation throughout the advance with several explosive breakout days coinciding with moves through psychological barriers at USD 400, USD 600, USD 800, USD 1,000, USD 1,200, and USD 1,500. However, support structures are now extraordinarily distant—the nearest meaningful support resides at USD 1,200, with deeper support at USD 1,000, USD 800, and the critical 200-day Moving Average near USD 500. The risk/reward profile has deteriorated substantially as new positions face 50%+ downside potential to key support levels versus perhaps 10-20% additional upside before technical exhaustion becomes overwhelming.
Intel Corporation: The Turnaround Story at +243% YTD
Fundamental Profile and Financial Performance
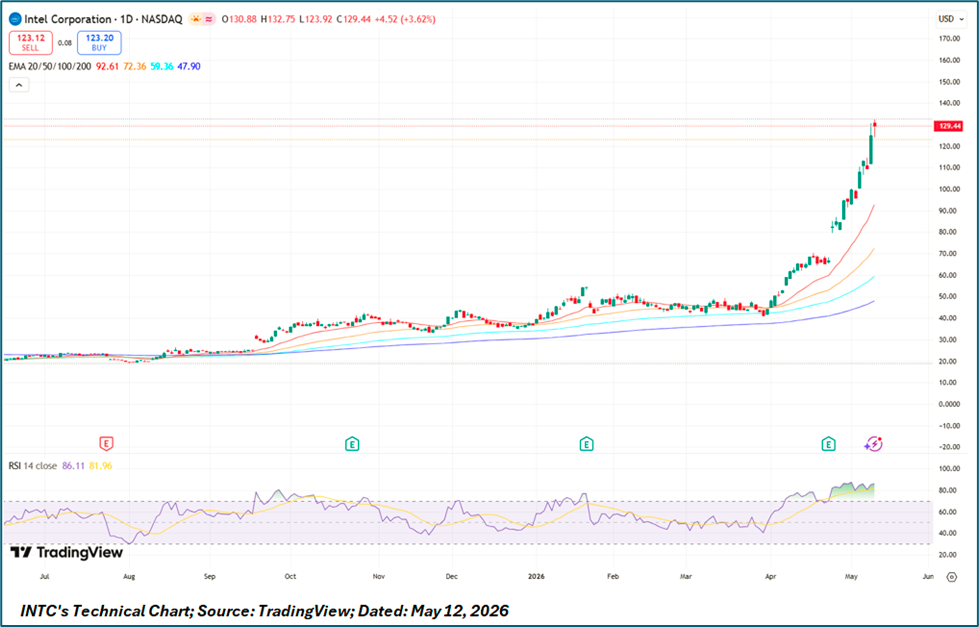
Intel Corporation's 242.71% advance from USD 30 to USD 129.44 represents the second-strongest performance in the cohort and arguably the most remarkable given the company's negative trailing earnings of USD -0.63 per share. The USD 650.57 billion market capitalization reflects not current profitability but rather investor conviction that new management can execute a multi-year turnaround strategy encompassing manufacturing recovery, foundry business development, and AI accelerator competitiveness. Financial metrics reveal a business in severe distress: gross margin of 35.90% has contracted from the 60%+ levels Intel enjoyed during its peak, operating margin of 2.47% barely covers expenses, and net margin of -5.90% demonstrates the company is destroying value at the Bottom Line. Free cash flow margin of -5.80% indicates Intel is burning cash despite reducing capital expenditures, while ROA of -1.60% and ROE of -3.01% confirm value destruction at the enterprise level. The company spends an extraordinary 25.13% of revenue on R&Amp;D—the highest among peers and essential for technology catch-up but a significant drag on near-term profitability.
The rally reflects a fundamental repricing from despair to cautious optimism. At USD 30, the market was pricing in potential Bankruptcy or asset Liquidation scenarios. The recovery reflects several catalysts: USD 8.5 billion in CHIPS Act funding that reduces capital requirements for domestic manufacturing expansion, manufacturing roadmap updates suggesting progress toward competitive Parity with TSMC, and industry tailwinds from AI infrastructure spending. The market is valuing Intel on a forward basis, implicitly assuming return to profitability generates EPS of USD 3-5 within 2-3 years, which would imply a forward P/E of 25-40x—elevated but potentially justified for a successful turnaround.
Technical Analysis
Intel's technical chart exhibits one of the most dramatic turnaround patterns in large-cap semiconductors, with price action suggesting a major sentiment shift from Capitulation to momentum-driven accumulation. From lows near USD 30 in mid-2025—levels not seen since 2013—the stock has rocketed to USD 129.44, a 331% advance that far exceeds any fundamental improvement in business operations. The recovery began with a capitulation bottom in summer 2025 where the stock traded at levels implying near-zero value for Intel's manufacturing assets and intellectual property. The subsequent rally has established key consolidation zones at USD 45-50, USD 70-75, and most recently USD 105-115, each providing launching pads for subsequent advances. The stock currently trades above all major moving averages, with the 20-day EMA near USD 92, the 50-day near USD 73, the 100-day near USD 56, and the 200-day near USD 48, creating a steep upward staircase defining the recovery trend. The RSI oscillator registers approximately 86 on the daily timeframe—deeply overbought territory that historically signals near-term exhaustion. The pace of advance has accelerated recently, with the move from USD 85 to USD 129 occurring in under five weeks, representing a 52% gain that technical analysts characterize as parabolic and unsustainable. Support structures are extremely distant—nearest meaningful support resides at USD 105-110, with deeper support at USD 85-90 and USD 70-75. A retest of USD 70-75 would represent a 40-45% correction but maintain the longer-term recovery trend integrity.
Seagate Technology: Pure-Play HDD Specialist at +196% YTD
Fundamental Profile and Financial Performance
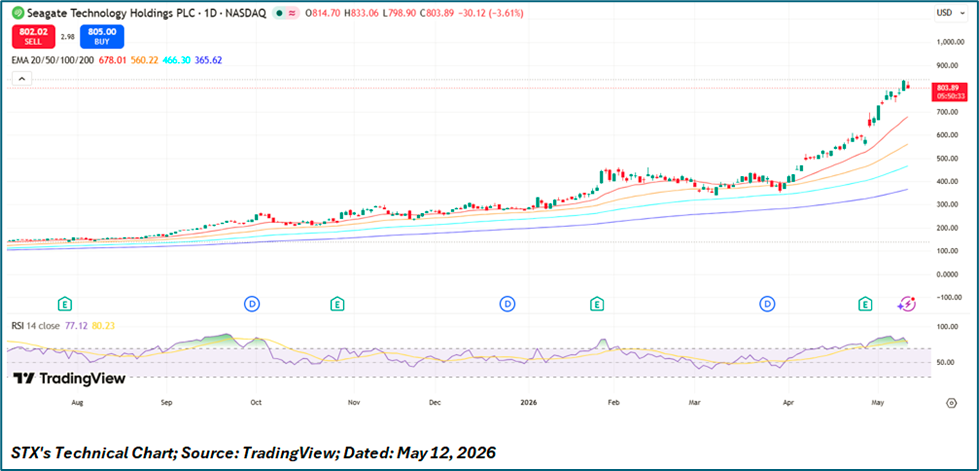
Seagate Technology's 195.78% advance to USD 834.01 validates the strategic bet that hard disk drives retain competitive advantages in cost-per-terabyte economics despite the flash revolution. The USD 187.01 billion market capitalization positions Seagate as the larger of two remaining pure-play HDD manufacturers, with the stock trading at 79.17x trailing earnings—an elevated multiple implying robust growth expectations for a nominally mature technology segment. Financial metrics demonstrate operational excellence: gross margin of 41.54% represents substantial improvement from 30-35% during the 2022-2023 downturn, operating margin of 29.46% and net margin of 21.60% reflect efficient operations, while ROA of 28.90% is exceptional for capital-intensive manufacturing. The stratospheric ROE of 1,787.97% suggests minimal equity capital, likely due to share Buybacks and Debt Financing creating a leveraged structure that amplifies returns during prosperous periods but magnifies risk during downturns.
The performance surge reflects the HDD business renaissance driven by AI training datasets. Large language models generate massive archival storage requirements—hundreds of petabytes per training run—where HDDs deliver 4-6x better cost-per-terabyte than flash, making them economically superior for bulk storage. Hyperscalers are deploying tiered storage architectures with flash for performance-critical data and HDDs for archival and warm storage tiers, positioning Seagate's nearline enterprise drives as essential infrastructure. The company's HAMR (heat-assisted magnetic recording) technology roadmap targets 30TB+ drives, essential for maintaining cost-per-terabyte advantages as flash costs decline.
Technical Analysis
Seagate's technical chart exhibits a powerful, methodical advance that has respected key moving averages and established well-defined support zones throughout the rally. From mid-2025 lows near USD 250, the stock has climbed steadily to USD 834, establishing a textbook uptrend characterized by higher highs, higher lows, and strategic consolidation phases that prevented overextension. The stock consolidated gains at multiple intervals—notably in the USD 400-450 range during late 2025 and the USD 650-700 zone during February 2026—allowing technical indicators to reset while building support structures. Price action has remained consistently above rising 20-day, 50-day, 100-day, and 200-day EMAs, with the 50-day currently near USD 568, the 100-day near USD 406, and the 200-day near USD 366, creating a staircase of support levels defining the Bull Market structure. The RSI oscillator registers approximately 77 on the Daily Chart—elevated but not extreme, though suggesting limited room for short-term appreciation without consolidation. Volume patterns have been constructive with accumulation visible throughout and several high-volume breakout days at key psychological levels. The recent +6.56% advance occurred on above-average volume, indicating institutional participation. Primary support now resides at the USD 700 consolidation zone with secondary support at the 50-day EMA near USD 568. Failure to hold USD 700 would likely trigger profit-taking extending toward USD 550-600, representing a 25-30% correction but maintaining longer-term uptrend integrity.
Western Digital: Diversified Storage Leader at +191% YTD
Fundamental Profile and Financial Performance
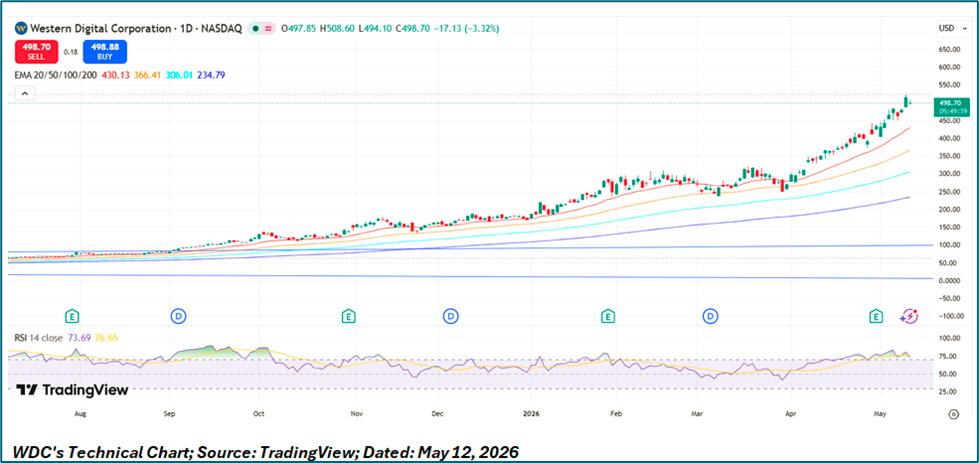
Western Digital Corporation's 191.10% advance to USD 515.83 reflects its unique dual-platform positioning across both NAND flash and HDD technologies. The USD 177.8 billion market capitalization makes WDC one of the largest pure-play storage companies globally, with the stock trading at 30.79x trailing earnings—the most reasonable valuation among major storage peers and a premium to historical cyclical lows but moderate within recovery-phase norms. Financial metrics reveal peak operational efficiency: gross margin of 45.39% significantly exceeds storage industry averages, while the reported net margin of 54.16% appears inflated by non-operating items (as it exceeds operating margin of 31.15%), though the underlying operational profitability is genuinely exceptional. ROA of 40.61% and ROE of 85.87% place WDC among the most capital-efficient technology companies, while free cash flow margin of 24.67% demonstrates the business generates substantial cash after funding maintenance capital expenditures.
WDC's Diversification across NAND and HDD provides strategic hedging—if flash demand softens, HDD economics may remain favorable, and vice versa. The company entered the AI boom with lean operations and underutilized capacity following industry downturn, positioning it for maximum operating Leverage as demand recovered. Both business segments are benefiting from AI infrastructure: enterprise SSDs for high-performance workloads and nearline HDDs for archival storage, allowing WDC to capture value across the storage hierarchy.
Technical Analysis
Western Digital's technical chart demonstrates a powerful recovery trend with disciplined price action and healthy consolidation phases distinguishing it from more speculative names. From mid-2025 lows near USD 200, WDC has advanced methodically to USD 515.83, establishing a pattern of higher highs and higher lows considered the hallmark of sustainable uptrends. Unlike parabolic blow-offs, WDC consolidated gains at multiple intervals—most notably in the USD 300-350 range during late 2025 and again in the USD 450-480 range during early 2026, allowing the stock to digest gains while building support structures that could limit downside. Price remains comfortably above all key moving averages with the 20-day EMA near USD 430, the 50-day near USD 346, the 100-day near USD 306, and the 200-day near USD 235, creating a staircase of support levels defining the uptrend structure. The RSI oscillator registers approximately 73 on the daily timeframe—elevated but not extreme, suggesting room for further appreciation before technical exhaustion signals emerge. Volume analysis reveals consistent accumulation throughout with several high-volume breakout days coinciding with moves through USD 300, USD 400, and USD 500 psychological barriers. The recent +7.46% single-day advance occurred on above-average volume, indicating institutional conviction rather than low-quality speculative buying. Unlike more extended names, WDC maintains a reasonable support cushion—the 50-day EMA at USD 346 represents a 33% drawdown from current levels, providing a technical backstop that could attract buyers on any meaningful pullback.
Lumentum Holdings: Optical Networking Specialist at +178% YTD
Fundamental Profile and Financial Performance
Lumentum Holdings' 177.58% advance to USD 1,053.09 reflects its specialized positioning in optical components essential for AI datacenter interconnects. The USD 81.93 billion market capitalization—smallest among the cohort—trades at 195.45x trailing earnings, an elevated multiple implying the market is pricing in several years of exceptional revenue and margin expansion. With trailing EPS of just USD 5.39, the valuation appears stretched by conventional metrics, suggesting investors are betting on fundamental business transformation rather than incremental growth. Profitability metrics reveal a business in transition: gross margin of 35.36% trails optical networking peers, operating margin of 10.18% and net margin of 17.68% suggest reasonable operational efficiency though the net margin likely benefits from non-operating items. More concerning is negative free cash flow margin of 4.58%, indicating Lumentum is consuming cash to fund growth initiatives—sustainable only if revenue inflection materializes as expected. ROA of 8.00% and ROE of 22.83% are respectable but unremarkable given the aggressive valuation multiple.
Lumentum manufactures specialized optical components—lasers, modulators, photodetectors—that form the backbone of datacenter interconnects. As AI workloads drive exponential growth in datacenter optical networking requirements, with each new AI model generation demanding roughly 10x more inter-server bandwidth, Lumentum's optical transceiver business faces sustained secular tailwinds. The company is expanding capacity for 800G and 1.6T optical transceivers essential for next-generation AI datacenter architectures.
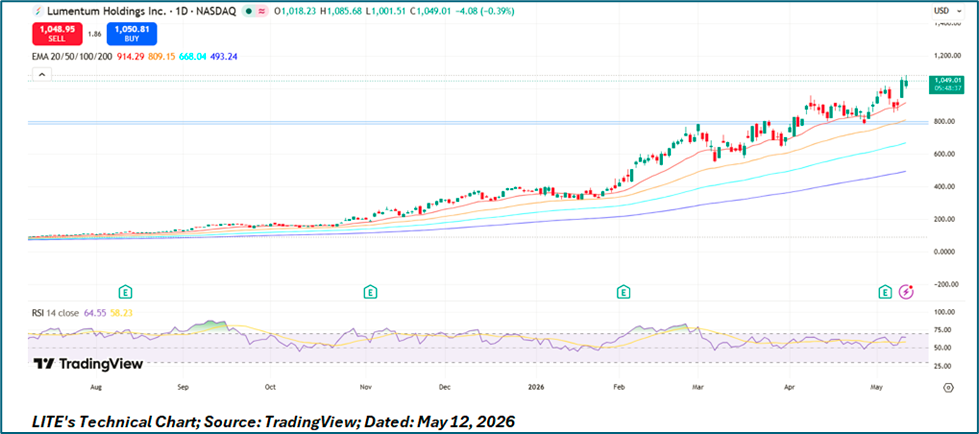
Technical Analysis
Lumentum's technical chart reveals relentless bullish momentum with mounting extension risk. The daily chart shows a remarkably consistent uptrend from July 2025 through May 2026, with the stock advancing from roughly USD 200 to USD 1,053—a 426% gain with minimal meaningful corrections. Price action has remained persistently above rising 20-day, 50-day, 100-day, and 200-day EMAs throughout the entire period, a textbook definition of strong primary uptrend. Recent parabolic acceleration from USD 800 in mid-April to current levels represents a 32% advance in less than one month, suggesting climactic buying that historically precedes consolidation or Reversal. The RSI oscillator registers approximately 64 on the daily timeframe—elevated but not yet at extreme levels indicating imminent exhaustion. Volume patterns show consistent accumulation throughout the advance with several high-volume breakthrough days at key psychological levels. However, the lack of any significant pullback or consolidation phase over ten months is both impressive from momentum perspective and concerning from risk management standpoint, as even the strongest bull markets typically consolidate gains periodically. Support levels are extremely distant—the 200-day EMA currently resides near USD 493, implying 53% drawdown potential in event of momentum reversal. The technical setup suggests continuation is probable near-term given trend strength, but risk/reward has deteriorated substantially as the stock enters what technical analysts characterize as a blow-off phase where gains accelerate beyond sustainable rates.
Common Tailwinds: The AI Infrastructure Boom
Several powerful structural trends unite these disparate businesses and explain the extraordinary performance concentration in 2026:
Exponential AI Compute Requirements: Training frontier AI models requires computational resources that dwarf prior generations. GPT-4 scale models consume thousands of GPUs, petabytes of high-speed storage, and terabits-per-second of inter-GPU bandwidth. Each successive model generation demands roughly 10x more resources across all dimensions, creating insatiable demand for the infrastructure these companies provide. This is not a one-time buildout but rather a sustained wave of capacity expansion as enterprises deploy AI applications.
Datacenter Architecture Evolution: AI workloads are fundamentally reshaping datacenter design. Traditional three-tier storage architectures are giving way to purpose-built AI infrastructure featuring GPU clusters interconnected with optical networking, high-performance flash storage for active datasets, and high-capacity HDD storage for archival needs. This architectural shift creates greenfield demand rather than mere replacement cycles, explaining why companies like Seagate and Western Digital—operating in supposedly mature markets—are experiencing renaissance periods.
Supply Constraints and Pricing Power: The velocity of AI infrastructure deployment has caught suppliers unprepared. NAND production capacity, optical component manufacturing, and even HDD production are constrained relative to demand, creating pricing power that has driven exceptional margin expansion. This supply-demand imbalance may persist for 18-24 months before capacity additions normalize pricing, providing runway for continued profitability.
Government Industrial Policy: The CHIPS Act and similar initiatives provide both direct financial support (Intel's USD 8.5 billion) and indirect benefits through domestic manufacturing incentives. This reduces capital intensity for domestic expansion and creates political tailwinds supporting the sector.
Risk Factors and Valuation Concerns
Despite powerful tailwinds, meaningful risks temper the bullish narrative:
Cyclical Reversion: Technology infrastructure markets exhibit pronounced boom-bust characteristics. Current supply constraints could incentivize capacity additions that create oversupply within 18-24 months, triggering pricing pressure and margin compression. NAND, HDD, and optical markets have all experienced such cycles historically—the current boom may sow seeds of the next bust.
Valuation Extension: Following advances of 175-533%, these stocks have priced in multiple years of flawless execution. P/E multiples of 54-195x leave no room for disappointment. Even modest shortfalls in revenue or margin expectations could trigger 40-60% corrections as multiples contract toward historical norms.
Technology Displacement: Flash continues advancing cost-per-bit economics, potentially accelerating HDD displacement. Breakthrough developments in next-generation memory technologies could disrupt NAND incumbents. Competitive dynamics in any segment could shift rapidly given the pace of innovation.
Customer Concentration: All five companies derive substantial revenue from a handful of hyperscale cloud operators. These customers possess significant bargaining leverage and could pressure pricing or shift orders based on minor performance differences. Insourcing efforts by hyperscalers represent existential threats to third-party suppliers.
Investment Implications and Outlook
The extraordinary performance of these five stocks reflects genuine fundamental drivers rather than speculative excess. AI infrastructure deployment is real, measurable, and accelerating. The companies analyzed generate substantial cash flows and, with Intel as the exception, demonstrate expanding profitability. This distinguishes 2026 from prior technology bubbles built on narratives rather than earnings.
However, risk/reward profiles have deteriorated substantially following the massive advances. For new investors, these stocks present unfavorable entry points—much of the AI infrastructure thesis has been priced in, and the probability of negative surprises exceeds the probability of further multiple expansion. Technical charts across the board show extension characteristics that historically precede corrections: parabolic trajectories, distant support levels, elevated momentum indicators, and in several cases, blow-off volume patterns.
Existing shareholders face difficult decisions. The momentum remains powerful, arguing against premature profit-taking, yet prudent risk management suggests trimming positions following such extraordinary gains. A reasonable approach: take partial profits (30-50% of positions) to lock in returns while maintaining exposure to potential further upside, and implement trailing stop-loss orders at key technical support levels (SNDK: USD 1,200; INTC: USD 105; STX: USD 700; WDC: USD 450; LITE: USD 800).
Among the five, Western Digital presents the most favorable risk/reward at current levels given its 30.79x P/E—the lowest multiple in the cohort—combined with genuine operational excellence and diversification benefits from its dual NAND/HDD platform. Intel represents the highest-risk, highest-reward proposition as a turnaround story with negative earnings but massive scale and government support. SanDisk and Lumentum trade at valuations requiring flawless execution with minimal margin for error. Seagate occupies middle ground—reasonable profitability but elevated multiple and cyclical exposure.
For patient investors, better entry opportunities will likely emerge following inevitable corrections. A 35-50% pullback across the cohort would align valuations with technical support levels and create more attractive risk/reward profiles. The secular AI infrastructure theme remains intact, but timing matters—buying parabolic advances at all-time highs rarely produces satisfactory risk-adjusted returns. The prudent approach: watch from the sidelines, allow technical excess to unwind, and allocate capital when valuations and chart patterns offer more favorable risk/reward rather than chasing momentum at peaks.


 Please wait processing your request...