
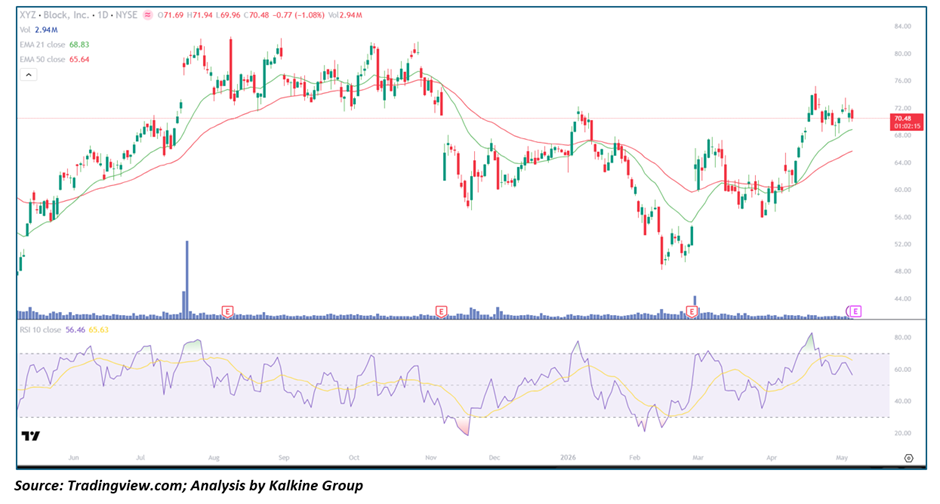
Key Highlights
- Block, Inc. (NYSE: XYZ) is trading near $70.56, down -0.97%, as the stock consolidates after a strong recovery from February 2026 lows near $50
• Price remains above the 21-day EMA (~$68.83) and 50-day EMA (~$65.65), maintaining bullish Moving Average alignment
• RSI-10 at 56.87 with smoothing near 65.66 reflects a healthy momentum reset from prior overbought levels
• Volume at ~2.94M remains moderate, indicating orderly consolidation rather than distribution
• Structure shows a sustained recovery with higher highs and higher lows since the February base
Trend Structure: Recovery Phase with Constructive Pullback
Block is maintaining a well-defined bullish recovery structure following a volatile prior year.
Key observations include:
• Strong rally from ~$48 (June 2025) to ~$82–$83 (August 2025)
• Subsequent correction into early 2026, forming a base near $49–$50
• Sustained recovery from February lows, reclaiming $60, $65, and now $70 zones
This suggests:
• The February lows represent a key structural base
• Buyers have regained control across short- and medium-term timeframes
• Current pullback is a normal pause within an ongoing uptrend
Price Action: Controlled Consolidation After Strong Rally
Recent price behavior highlights stability after a sharp advance:
- ~48% rally from $50 to $73–$74 between February and April 2026
• Current pullback remains shallow and well-contained
• Intraday range ($69.96–$71.94) reflects controlled price action
This implies:
• $68–$70 zone is emerging as strong Demand support
• Prior resistance is now acting as support (role Reversal)
• Higher-low structure remains intact
Moving Averages: Strong Bullish Alignment
The moving average configuration remains firmly supportive:
- Price is above EMA-21 (~$68.83) and EMA-50 (~$65.65)
• EMA-21 is above EMA-50, confirming a sustained golden cross
• Both EMAs are trending upward, reflecting trend strength
Interpretation:
• Short-term trend remains bullish
• EMA-21 acts as immediate dynamic support
• EMA-50 provides a strong secondary support zone
Momentum Indicators: Healthy Reset
RSI-10 at 56.87, smoothing at 65.66
Key signals:
• RSI has cooled from overbought levels — a constructive reset
• Smoothing average remains elevated, indicating strong underlying momentum
• No bearish divergence present
Interpretation:
• Momentum reset supports continuation of the uptrend
• RSI stabilizing near 55–60 is ideal for next rally leg
• Room remains for further upside expansion
Volume Analysis: Stable Participation
Volume trends remain supportive of the recovery:
- No signs of heavy selling during the pullback
• Moderate and steady participation during consolidation
• Absence of distribution signals
This indicates:
• Pullback is not driven by institutional selling
• Recovery remains accumulation-driven
• Breakout attempts may require volume expansion
Market Structure: Transition into Intermediate Uptrend
The broader structure reflects improving technical strength:
- Recovery from February lows is the most structured rally in recent cycles
• Higher highs and higher lows define current trend
• Stronger EMA alignment compared to prior recovery attempts
This suggests:
• Trend continuation remains the dominant scenario
• Pullbacks toward $68–$65 should be viewed as opportunities
• Break above $73–$74 could accelerate upside momentum
Key Technical Levels and Scenarios
Support Levels
• $68.83 as immediate support (EMA-21)
• $65–$66 as secondary support (EMA-50)
• $59–$60 as deeper structural support
Resistance Levels
• $73–$74 as immediate resistance
• $78–$80 as next upside target
• $82–$83 as major resistance
Scenarios
- Bullish Continuation (Primary Case)
• Price holds above $68–$69
• RSI stabilizes above 55
• Breakout above $73–$74 with volume
• Upside toward $78–$80 - Consolidation (Secondary Case)
• Range between $67 and $74
• EMAs continue rising
• RSI oscillates between 50–68
• Setup for future breakout - Pullback Scenario (Low Probability)
• Break below EMA-21
• Retest of EMA-50 near $65–$66
• Buyers likely to defend this zone
Conclusion: Bullish Recovery Intact with Healthy Consolidation
Block, Inc. continues to display a strong recovery structure supported by bullish EMA alignment, steady volume, and a constructive momentum reset. The current -0.97% pullback is consistent with normal consolidation following a significant rally and does not indicate structural weakness. As long as price holds above the EMA-21 (~$68.83), the bullish outlook remains intact, with potential for a breakout above $73–$74 to drive the next leg higher toward the $78–$80 zone.


 Please wait processing your request...