
Key Highlights
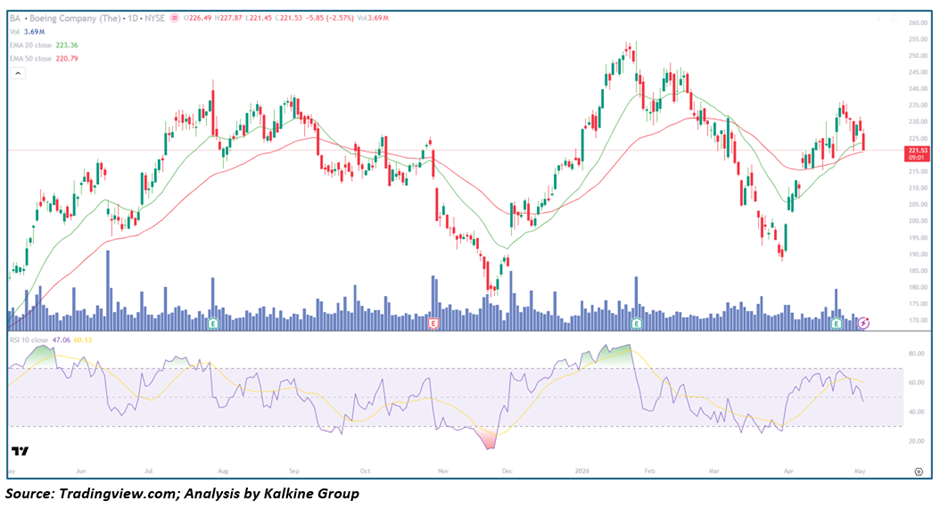
- Boeing Company (NYSE: BA) is trading near the 221–222 zone after failing to sustain recent recovery gains
• Price is hovering around the 20-day (~223.36) and slightly above the 50-day (~220.79) moving averages
• RSI near ~47 indicates weakening momentum with a slight bearish bias
• Volume remains moderate with no strong accumulation signals
• Structure shows lower highs forming after a recent rejection from higher levels
Trend Structure: Weak Recovery Within Broader Range
BA is showing signs of weakness following a short-lived recovery.
Key observations include:
• Prior rally toward the 250–255 zone faced strong rejection
• Formation of lower highs and failure to sustain upward momentum
• Price drifting back toward mid-range levels
This suggests:
• Buyers are losing control
• Sellers are gradually regaining dominance
• Trend remains uncertain with bearish tilt
The structure reflects a range-bound market with downside risk increasing.
Price Action: Rejection and Weak Follow-Through
Recent price behavior highlights caution:
- Sharp rejection from recent highs
• Inability to hold above key resistance zones
• Increasing bearish candles near current levels
This implies:
• Supply pressure at higher levels
• Lack of sustained buying interest
• Weak bullish conviction
Such action typically signals:
• Potential continuation of downside move
• Increased probability of range breakdown
Moving Averages: Neutral to Slightly Bearish
The moving average setup indicates weakening structure:
- Price fluctuating around the 20-day MA
• 20-day MA flattening
• 50-day MA acting as near-term support
Interpretation:
• Short-term trend losing strength
• Medium-term trend neutral
• Breakdown risk if support fails
Momentum Indicators: Bearish Shift
RSI is drifting toward the 45–50 zone.
Key signals:
• Momentum weakening
• No bullish strength visible
• Slight bearish bias emerging
Interpretation:
• Upside momentum fading
• Risk of further downside
• Weak trend environment
Volume Analysis: Lack of Strong Demand
Volume trends indicate:
- Moderate activity without spikes
• No strong accumulation
• Absence of aggressive buying
This suggests:
• Weak participation
• Lack of institutional conviction
• Move lacks strong support
Market Structure: Range with Downside Pressure
The broader structure reflects:
- Repeated rejection from higher levels
• Inability to sustain higher highs
• Gradual drift lower
This combination suggests:
• Increasing downside pressure
• Potential breakdown scenario
• Weak overall structure
Key Technical Levels and Scenarios
Support Levels
- 220 as immediate support
• 210 as short-term support
• 195–200 as major support zone
Resistance Levels
- 230 as immediate resistance
• 245 as next upside zone
• 255 as major resistance
Scenarios
- Bearish Continuation (Primary Case)
• Price breaks below 220
• Momentum weakens further
• Move toward 200–210 - Consolidation (Secondary Case)
• Price holds between 220–230
• RSI remains neutral
• Range-bound movement continues - Bullish Reversal (Low Probability)
• Price reclaims 230
• Strong volume expansion
• Move toward 245–255
Conclusion: Weak Structure with Breakdown Risk
Boeing Company is showing signs of weakening momentum following a failed recovery attempt. With price hovering near key support and momentum indicators turning neutral-to-bearish, the risk of a downside move is increasing. Unless the stock reclaims higher resistance levels with strong volume, the broader structure suggests caution with a potential breakdown scenario.


 Please wait processing your request...