
Key Highlights
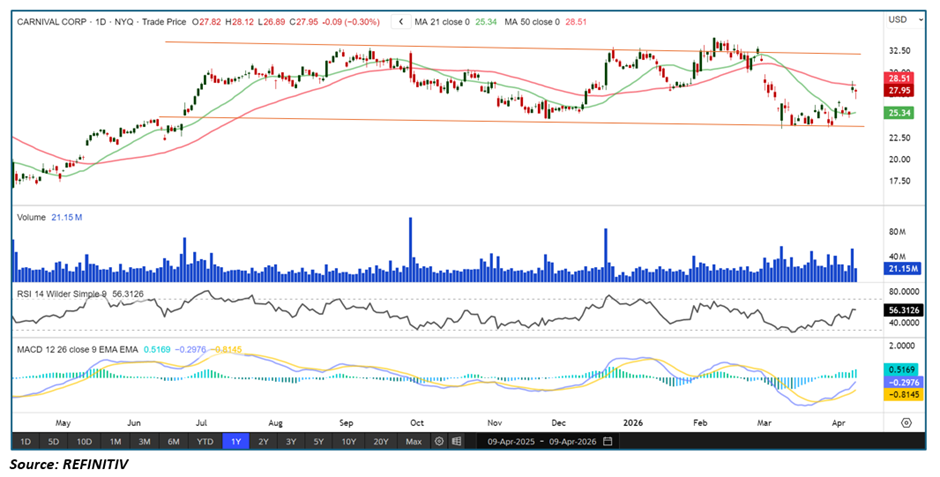
- Carnival Corporation & plc (NYSE: CCL) has taken support near the lower boundary of a long-term sideways channel, indicating a strong demand zone
• Price has rebounded and is now moving toward a retest of the upper band of the channel
• The stock is trading above the 21-period SMA but below the 50-period SMA, reflecting improving short-term momentum within a broader neutral structure
• The 14-period RSI is in positive territory, signaling strengthening momentum
• MACD histogram has turned positive, indicating early bullish momentum buildup
Trend Structure: Sideways Channel Defines Price Action
Carnival Corporation has been trading within a well-defined long-term sideways channel, with price oscillating between support and resistance zones. This structure reflects a period of consolidation where neither bulls nor bears have full control.
The recent price action highlights a key development—price has taken support at the lower band of the channel, a zone that has historically acted as a strong demand area.
Such behavior suggests:
• Buyers stepping in at key support levels
• Reduced selling pressure near channel lows
• Potential continuation toward the upper boundary
If this channel structure remains intact, the stock may continue to oscillate toward the upper band in the near term.
Price Action: Strong Rebound from Channel Support
CCL has staged a notable recovery after testing the lower boundary of its sideways range. The rebound reflects renewed buying interest and improving sentiment.
Key observations:
• Clear bounce from channel support zone
• Formation of higher lows indicating improving structure
• Gradual upward movement toward resistance
This type of price action often indicates a mean-reversion move within a range, where price travels from support toward resistance. The ongoing move suggests that the stock may soon retest the upper band of the channel.
Moving Average Analysis: Short-Term Strength, Medium-Term Resistance
The moving average setup presents a mixed but improving picture:
- 21-period SMA: Price trading above, acting as short-term support
• 50-period SMA: Positioned above price, acting as immediate resistance
• Trend implication: Short-term bullish within a broader neutral structure
Holding above the 21-SMA suggests that near-term momentum has shifted in favor of buyers. However, the presence of the 50-SMA overhead indicates that the stock still faces resistance before confirming a stronger trend reversal.
A sustained move above the 50-period SMA would be a key bullish confirmation signal.
RSI Momentum: Positive Territory Signals Strength
The Relative Strength Index (RSI) is currently holding in positive territory above the 50 level, reflecting strengthening momentum.
Current RSI signals:
• Sustained above midpoint (50)
• Upward bias indicating increasing buying pressure
• No immediate signs of weakness
An RSI in positive territory typically suggests that buyers are in control in the short term, supporting the ongoing recovery toward the upper channel boundary.
MACD Indicator: Histogram Turns Positive
The MACD indicator is reinforcing the bullish recovery narrative, with the histogram moving into positive territory.
Key signals:
• MACD histogram above zero line
• Increasing positive bars indicating momentum pickup
• Early-stage bullish momentum formation
A positive MACD histogram suggests that short-term momentum is accelerating, increasing the probability of continued upside movement.
Market Structure: Range-Bound Recovery in Progress
The current setup in CCL reflects a range-bound recovery phase, characterized by:
• Bounce from strong support levels
• Gradual upward movement within a defined channel
• Improving momentum indicators
While the broader trend remains sideways, the short-term structure indicates that the stock is moving toward a resistance test, which could define the next directional move.
Key Technical Levels & Targets
- Immediate Resistance: Upper band of the sideways channel
• Next Upside Target: Breakout above channel could open further upside
• Immediate Support: 21-period SMA
• Strong Support: Lower boundary of the channel
A successful retest and breakout above the upper band could signal a transition from consolidation to a bullish trend phase.
Key Technical Scenarios
- Range Continuation (Primary Scenario)
- Price moves toward upper channel band
• RSI remains above 50
• MACD histogram stays positive
• Resistance test likely in near term
- Breakout Scenario
- Price breaks above upper channel resistance
• Moves above 50-SMA
• Momentum accelerates with strong follow-through
- Rejection at Resistance
- Price faces selling pressure near upper band
• Pullback toward 21-SMA
• Channel structure remains intact
Risk Considerations
- Rejection near the upper channel band could limit upside
• Failure to hold above the 21-SMA may weaken short-term momentum
• Overhead resistance at the 50-SMA remains a key hurdle
• Broader market weakness could impact recovery
Conclusion: Channel Support Drives Near-Term Upside Potential
Carnival Corporation has shown a constructive rebound after taking support at the lower boundary of its long-term sideways channel. The move is supported by improving momentum indicators, with RSI in positive territory and a positive MACD histogram.
Trading above the 21-period SMA reflects strengthening short-term momentum, though resistance at the 50-period SMA and the upper channel band remains a key challenge.
If momentum sustains, CCL is well-positioned to retest the upper boundary of the channel in the near term. A breakout above this level would mark a significant shift in trend, while rejection could keep the stock within its established range.Top of Form


 Please wait processing your request...