
Key Highlights
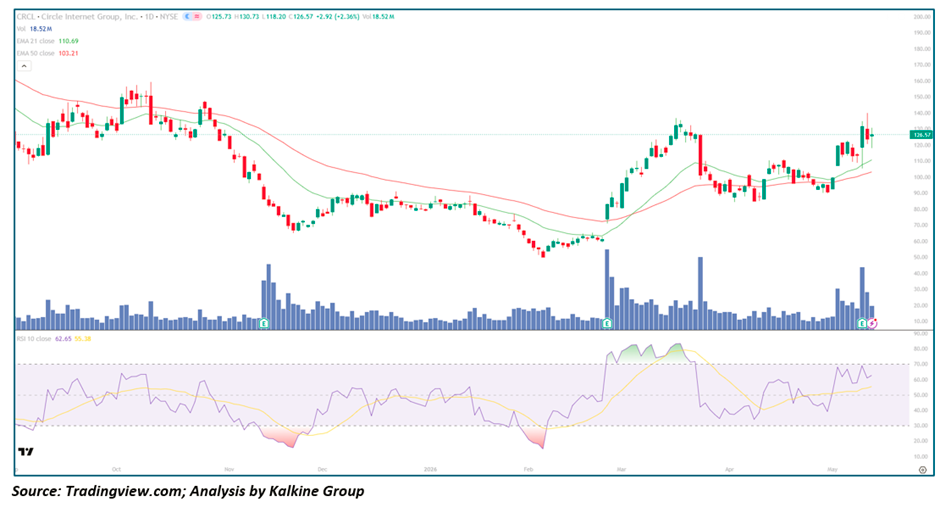
- Circle Internet Group (NYSE: CRCL) is trading at $126.57, up +$2.92 (+2.36%) on the day, recovering sharply from an intraday low of $118.20 — a strong intraday Reversal signalling renewed buying conviction after the recent consolidation pull-back from the February peak zone
- Price is comfortably above both EMA-21 ($110.69) and EMA-50 ($103.21), a bullish EMA alignment confirming that the primary uptrend from the December 2025 lows near $60 remains structurally intact
- RSI-10 at 62.65 with signal at 55.38 — RSI is above its signal line and trending upward from a mid-range base, indicating building momentum without overbought excess — a constructive setup pointing toward further upside
- Volume at 18.52M shares is elevated and among the higher daily readings on the chart, consistent with institutional participation on today's recovery move
- CRCL has charted a dramatic post-IPO journey: from a debut above $150 in October 2025, to a sharp correction toward $60 in December 2025, and now a powerful V-shaped recovery reclaiming the $120–$130 zone — one of the most volatile Fintech listings of the year
Trend Structure: Primary Bull Trend Reasserting — V-Shaped Recovery Gains Structural Credibility
The macro picture for CRCL is one of a volatile but structurally bullish instrument in the early stages of reasserting its primary uptrend. The stock's post-IPO correction from the $150+ debut highs to the December 2025 lows near $60 was severe — a greater-than-60% drawdown in roughly six to eight weeks — but critically, the recovery from those lows has been equally powerful, with price more than doubling from the trough to reclaim the $120–$130 range. This V-shaped recovery structure, combined with price now sustaining above both the EMA-21 and EMA-50, indicates that the post-IPO correction has been fully absorbed and the bullish primary trend is firmly reasserting itself. For CRCL, the directional trend now appears unambiguously upward.
Price Action: Intraday Reversal From $118 to $130+ — Bull Reclaim of Key EMA Zone
Today's price action is technically significant. The session opened at $125.73, dropped to a low of $118.20 — briefly testing the zone just above EMA-21 — before reversing sharply to a high of $130.73, a greater-than-$12 intraday swing that closed near session highs. This type of intraday reversal — deep dip, strong recovery, close near highs — is classically bullish and signals that Demand is absorbing Supply at lower levels. Immediate overhead resistance sits at the session high zone of $130–$131; a sustained close above that level opens the path toward the $140–$145 prior peak zone.
Moving Averages: Golden Cross Structure Intact — EMA-21 and EMA-50 Widening Bullishly
The Moving Average structure is unambiguously bullish. EMA-21 ($110.69) sits above EMA-50 ($103.21) — a golden cross alignment — and both averages are trending upward with increasing separation, a hallmark of strongly trending instruments. Price at $126.57 is approximately $16 above EMA-21 and $23 above EMA-50, reflecting genuine momentum rather than a mere resting on the averages. As long as price holds above EMA-21 on a closing basis, the bullish trend structure remains intact.
Momentum: RSI Bullish Crossover From Mid-Range — Setup Bulls Have Been Waiting For
RSI-10 at 62.65 crossing above its signal at 55.38 is a notably constructive development, occurring from a neutral base rather than overbought conditions. The chart reveals a clear repeating RSI rhythm: rise to overbought (green shaded zones), reset to oversold/neutral (red shaded zones), then relaunch into the next bullish impulse. The most recent RSI trough — dropping to the high-20s in early 2026 — was the deepest reset on the chart and typically precedes the most powerful subsequent rallies. The current positioning, with RSI at 62.65 and rising, matches almost precisely the early-stage setups seen before each prior bullish impulse. If the pattern repeats, RSI is heading back above 70, corresponding to a price push toward $140–$165.
Key Technical Levels
Resistance: $130–$131 (session high) → $140–$145 (prior peak) → $155–$165 (all-time high zone) Support: $110.69 (EMA-21) → $103.21 (EMA-50) → $90–$95 (structural base) → $65–$70 (Dec 2025 lows)
Scenarios
- Bullish Continuation (Primary Case) — RSI sustains above 60, price closes decisively above $130–$131 on volume, triggering acceleration toward $140–$145 and ultimately a retest of the $155–$165 all-time high zone. This is the primary case given the golden cross structure, building RSI momentum, and elevated volume on today's recovery.
- Extended Consolidation (Secondary Case) — CRCL oscillates between $100–$130 for another four to six weeks awaiting a fresh macro or company-specific catalyst before breaking decisively.
- Deeper Correction (Risk Case) — A close below EMA-21 ($110.69) and EMA-50 ($103.21) risks a retest of the $90–$95 structural base — a scenario requiring a broader risk-off event or negative company-specific development to materialise.
Conclusion: Bull Trend Intact — Momentum Building for Next Leg Toward $140–$165
CRCL's technical picture is one of a high-momentum fintech listing that has successfully absorbed its post-IPO correction and is reasserting its primary bull trend. The golden cross EMA structure, price sustainment well above both key averages, fresh RSI bullish crossover from mid-range, and today's strong intraday reversal all point in the same direction — the path of least resistance is upward. The immediate trigger bulls are watching is a sustained close above $130–$131; above that, the path toward $140–$145 and eventually the $155–$165 all-time high zone opens with limited structural resistance. Risk is well-defined at EMA-21 ($110.69), keeping the reward-to-risk profile attractive as long as that level holds.


 Please wait processing your request...