
Key Highlights
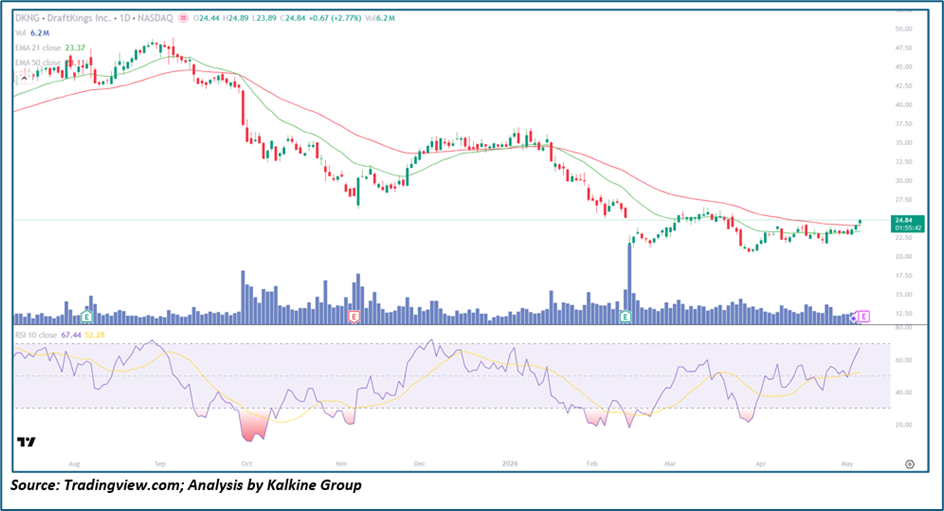
- DraftKings Inc. (Nasdaq: DKNG) is trading near the $24.84 level, gaining +2.77% as the stock attempts to stabilize after a prolonged decline from August 2025 highs near $48
• Price remains below the 21-day EMA (~$23.37) and 50-day EMA (~$28.11), though both averages are beginning to flatten and converge
• RSI-10 at 67.44 signals a sharp near-term momentum spike, while the smoothing average at 52.28 reflects still-moderate underlying momentum
• Volume saw a notable spike during the February 2026 Earnings period, followed by steady normalization during consolidation
• Structure indicates early-stage base formation within the $22–$25 range after a significant drawdown
Trend Structure: Downtrend Losing Strength
DKNG is showing signs that its prior downtrend is weakening, though a confirmed Reversal is not yet in place.
Key observations include:
• A sustained decline from ~$48 (August 2025) to ~$22 (February 2026), marking a ~54% correction
• A failed recovery attempt toward $35 in late 2025 before making new lows
• Formation of slightly higher lows since February, with price now testing the $24–$25 zone
This suggests:
• Selling pressure is gradually easing near the lows
• A tentative base is forming between $22 and $25
• A meaningful trend shift requires sustained strength above near-term resistance
The structure reflects an early transition phase rather than a confirmed bullish reversal.
Price Action: Consolidation After Sharp Decline
Recent price action highlights stabilization following a deep correction:
- Extended drop from $48 to $22 followed by range-bound movement
• Price consolidating within a tight $22–$26 band over recent months
• Latest move to ~$24.84 represents a constructive bounce but remains within the range
This implies:
• $22–$23 is acting as a strong Demand zone
• $25–$26 remains key overhead resistance
• Current price compression is consistent with base-building behavior
Moving Averages: Bearish Structure, Early Improvement
The Moving Average setup remains cautious but is evolving:
- Price is near EMA-21 (~$23.37) but still below EMA-50 (~$28.11)
• EMA-21 is flattening, indicating short-term trend neutralization
• EMA-50 continues to slope downward, acting as key resistance
Interpretation:
• Trend is still technically bearish but improving
• A sustained move above $26 would shift short-term bias to neutral-bullish
• EMA-50 near $28 is the next major hurdle for trend confirmation
Momentum Indictors: Short-Term Strength, Broader Neutrality
RSI-10 stands at 67.44, with smoothing near 52.28
Key signals:
• RSI spike reflects strong short-term buying interest
• Smoothing average indicates momentum is not yet sustained
• Prior oversold readings helped initiate the current recovery attempt
Interpretation:
• Momentum is improving but lacks confirmation
• Sustained RSI above 60 is needed for stronger bullish conviction
• Current setup suggests early recovery, not a full trend shift
Volume Analysis: Earnings-Driven Activity
Volume behavior offers mixed but constructive signals:
- Sharp volume spike during February earnings indicates institutional repositioning
• Post-event volume has normalized during consolidation
• Up days show relatively stronger participation than pullbacks
This indicates:
• The $22 base likely attracted accumulation interest
• Recovery has demand support, though not yet aggressive
• Breakout above $26 will require renewed volume expansion
Market Structure: Range-Bound Base Formation
The broader structure reflects a stock in transition:
- Downtrend phase has stalled near long-term support
• Price action shows a shift from lower lows to stabilization
• Defined range between $22–$26 acting as decision zone
This suggests:
• Market is building equilibrium after extended selling
• A breakout or breakdown from this range will define the next trend
• Base formation remains valid as long as $22 holds
Key Technical Levels and Scenarios
Support Levels
• $23.37 as immediate support (EMA-21)
• $22–$23 as key base support
• $20 as major structural support
Resistance Levels
• $25–$26 as immediate resistance
• $28.11 as EMA-50 resistance
• $33–$35 as next major upside zone
Scenarios
- Bullish Recovery (Primary Case)
• Price sustains above $24–$25
• Breakout above $26 with volume
• RSI smoothing builds above 60
• Upside toward $28 and $33–$35 - Consolidation (Secondary Case)
• Range persists between $22 and $26
• EMAs flatten further
• RSI oscillates in mid-range
• Base continues forming - Renewed Decline (Low Probability)
• Breakdown below $22 support on strong volume
• Weak demand invalidates base
• Downside toward $18–$20
Conclusion: Base Formation with Early Positive Signals
DraftKings Inc. is beginning to show early signs of stabilization after a prolonged downtrend, supported by base formation near $22–$23, a flattening EMA-21, and improving short-term momentum. However, the broader structure remains unconfirmed, with EMA-50 resistance near $28 still capping upside. As long as the base holds, the outlook remains cautiously constructive, with a breakout above $26 on strong volume acting as the key trigger for a more sustained recovery toward higher levels.


 Please wait processing your request...