
Key Highlights
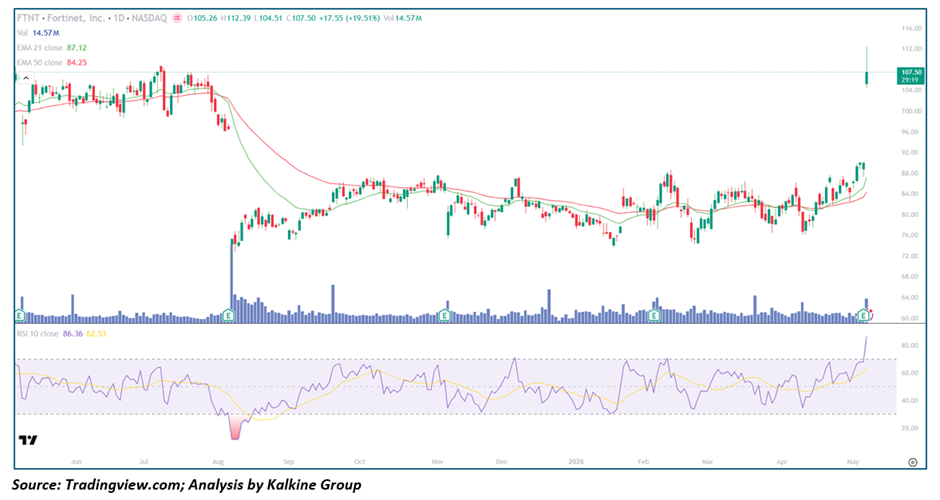
- Fortinet (Nasdaq: FTNT) is surging +19.51% to $107.50 on massive Volume of 14.57M, breaking decisively above a year-long consolidation range following what appears to be a strong Earnings catalyst
- Price has spiked well above both the 21-day EMA ($87.12) and 50-day EMA ($84.25), with the gap between price and moving averages reflecting the magnitude of the breakout
- RSI-10 at 86.36 has surged deep into overbought territory, with the smoothing average at 62.53 — signaling explosive near-term momentum, though a short-term cooling period is likely
- Volume at 14.57M is among the highest single-day readings in the past twelve months, confirming strong institutional conviction behind today's move
- Structure shows a prolonged base built between $76 and $90 over nearly ten months, with today's breakout potentially marking the beginning of a new trending phase
Trend Structure: Potential Trend Reversal from Extended Base
FTNT spent the better part of twelve months in a painful downtrend and subsequent range-bound consolidation after topping near $108–$110 in mid-2025. The stock declined sharply from those levels through August 2025 — touching lows near $74 — before entering a prolonged sideways phase between roughly $76 and $90 that persisted through early May 2026. Today's +19.51% earnings-driven surge has effectively erased months of overhead Supply in a single session, vaulting price back to the prior highs and potentially establishing the foundation for a new uptrend. The breakout above the $90 resistance zone — which capped multiple rally attempts over the past several months — is technically significant and shifts the medium-term bias decisively to the upside.
Price Action: Explosive Earnings Gap and Breakout
Today's price action is defined by a powerful earnings gap, with FTNT opening at $105.26, spiking to an intraday high of $112.39, and consolidating around $107.50 — still representing a gain of nearly $18 on the day. This type of gap-and-hold action, where price opens sharply higher and maintains most of its gains through the session, is typically a bullish signal indicating strong underlying Demand rather than a one-day wonder. The stock is now trading at levels last seen in June–July 2025, effectively recovering the entire downtrend in a single session. Near-term, some digestion of these gains is expected and healthy, with the $104–$105 intraday open level serving as the first support reference.
Moving Averages: Sharp Bullish Reclamation
The Moving Average picture for FTNT has been transformed by today's move. Price at $107.50 now sits approximately $20 above the EMA-21 ($87.12) and $23 above the EMA-50 ($84.25) — an unusually wide gap that reflects the explosive nature of the breakout. While the EMAs will take several sessions to catch up to price, this configuration is unambiguously bullish and confirms a decisive shift in trend direction. The EMA-21 and EMA-50 had been converging and beginning to turn upward in recent weeks, suggesting underlying accumulation was building ahead of today's catalyst. Going forward, the $87–$90 zone now represents a key EMA support level on any post-earnings pullback.
Momentum Indicators: Overbought but Powerfully Bullish
RSI-10 at 86.36 is firmly in overbought territory — the highest reading seen on this chart over the past twelve months. While this level of RSI elevation often precedes a short-term consolidation or modest pullback, in the context of a genuine earnings-driven breakout, overbought RSI can persist for several sessions before normalizing. The smoothing average at 62.53 is well below the RSI line, confirming that momentum expanded sharply and rapidly today. Traders should expect RSI to cool toward the 65–70 zone over the coming sessions as price digests the move, which would be a healthy reset without compromising the bullish breakout thesis.
Volume Analysis: Institutional Conviction Confirmed
Volume of 14.57M today represents one of the largest single-day volume readings on this chart, surpassed only by the August 2025 earnings-driven Capitulation spike. Crucially, today's volume is occurring on a massive up move rather than a down move — a clear signal of institutional buying and demand conviction. This level of volume on a breakout day is a strong confirmation signal that the move has genuine participation behind it and is not merely a low-Liquidity gap. The prior high-volume days on this chart were associated with selling pressure; today's reading on the buy side represents a meaningful shift in the supply-demand dynamic.
Key Technical Levels and Scenarios
Support Levels
- $104–$105 — Intraday gap-open support; first reference on any near-term pullback
- $90–$92 — Prior resistance now turned support; critical medium-term level
- $87.12 — EMA-21 rising support
Resistance Levels
- $112.39 — Today's intraday high; immediate resistance
- $115–$116 — Next upside target on continuation
- $120+ — Extended bullish target
Scenarios
- Bullish Continuation (Primary Case) — Price consolidates between $104 and $112 over the next several sessions, RSI cools to the 65–70 zone, and FTNT then resumes its advance toward $115–$120 on the next catalyst or organic buying.
- Post-Earnings Consolidation (Secondary Case) — Price pulls back to Fill part of the gap toward $95–$100, EMAs begin rising to meet price, and a fresh base is built before the next leg higher — a healthy outcome that would keep the bullish thesis intact.
- Gap Fill Scenario (Low Probability) — A broader market deterioration or fundamental disappointment triggers a deeper Retracement toward $90–$92; this level should attract significant demand given its technical significance as the prior range resistance now turned support.
Conclusion: Earnings-Driven Breakout Marks Potential Beginning of New Uptrend
Fortinet has delivered one of the most technically decisive single-session moves on its chart in over a year, with today's +19.51% earnings-driven surge breaking above a year-long consolidation range on the highest Buy-Side volume in months. The move has effectively reset the technical structure from bearish-to-neutral to unambiguously bullish, with price reclaiming both moving averages in a single session. While near-term overbought conditions on the RSI suggest some digestion is likely, the broader setup now favors trend continuation as the primary scenario. As long as FTNT holds above the $90–$92 breakout zone on any post-earnings pullback, the path of least resistance is toward $115 and beyond.


 Please wait processing your request...