Key Highlights
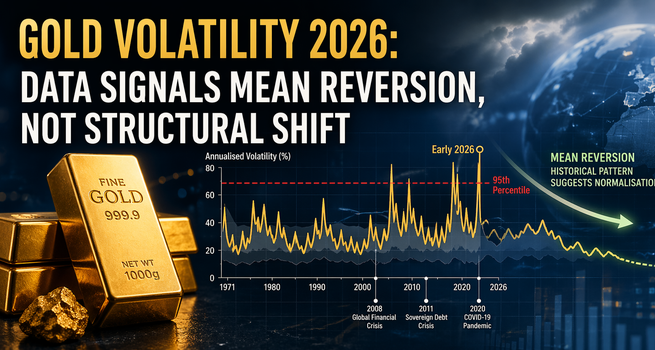
- Gold's volatility breached its historical 95th percentile in early 2026, driven by Fed rate expectations, USD reversal, and geopolitical shocks
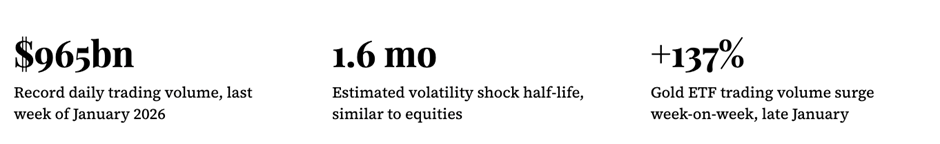
- Trading volumes hit a record US$965bn/day in late January — a sign of deep liquidity, not dysfunction
- Bid-ask spread spikes were episodic and confined largely to off-hours trading windows
- Historical data shows volatility shocks have a half-life of just 1.6 months, similar to equities
- Gold's low-negative correlation with equities keeps it a valuable strategic diversifier even in elevated volatility regimes
When gold's annualised volatility broke through the 95th percentile of its historical range in early 2026 — a threshold last meaningfully breached during the coronavirus panic and the Global Financial Crisis — the market took notice. Investors who had watched the metal climb from US$4,000 to US$5,500 an ounce in a matter of months found the subsequent turbulence unsettling. The question being asked across trading desks from London to Singapore is whether something has permanently changed in how gold behaves.
The answer, based on a comprehensive reading of the data, is almost certainly not. But the journey to that conclusion requires confronting a more nuanced picture than either the bulls or the bears are currently offering.
Gold's monthly realised volatility, 1971–2026
Annualised, based on daily LBMA Gold Price PM returns. Upper and lower quartile bands shown.
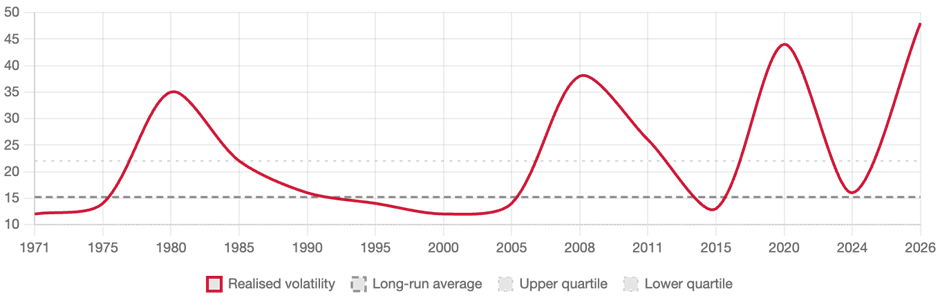
Source: ICE Benchmark Administration, World Gold Council. Based on LBMA Gold Price PM, January 1971–March 2026.
Four triggers, one storm. The volatility surge of 2026 was not the product of a single catalyst but the convergence of several. First, cooling Federal Reserve rate-cut expectations and renewed upward pressure on Treasury yields — sparked in part by the nomination of Kevin Warsh as Fed Chair in late January — reversed momentum that had been a steady tailwind for gold. Second, the dollar, which had been declining for three consecutive months, reasserted itself, providing a mechanical headwind for dollar-denominated assets.
Third, and perhaps most dramatically, the exponential final leg of gold's rally — the move from US$5,000 to US$5,500 in just three trading sessions — left the market technically stretched. The unwinding that followed was amplified by stop-loss orders clustering at key technical levels, creating a feedback loop that pushed volumes sharply higher and spreads wider. Fourth, the re-escalation of Middle East conflict raised both inflationary concerns and liquidity needs for market participants with exposure to Dubai and other regional trading hubs.
Is this time different? The mean-reversion case
Gold bears pointing to the volatility surge have a surface-level point. The breach of the historical 95th percentile is not trivial. Yet the same dataset that reveals this spike also offers a counterargument: gold's volatility has proven to be strongly mean-reverting over the entire history of the modern market. An autoregression analysis of monthly volatility data back to 1971 yields a persistence coefficient of 0.65 — statistically significant at the 99% confidence level — implying a half-life of approximately 1.6 months.
In plain terms: after a major shock, roughly half of the excess volatility dissipates within six weeks. This cadence is strikingly similar to equity volatility dynamics, and it has held across some of gold's most turbulent episodes — the GFC spike of October 2008, the sovereign debt crisis of late 2011, and the COVID-19 disruptions of March 2020. In each case, volatility normalised well within a quarter.
"After a major shock, roughly half of the excess volatility in gold dissipates within six weeks — a cadence that has held across the GFC, the sovereign debt crisis, and the COVID-19 disruption."
The structural parallel with 2026 is instructive. Cross-asset volatility data shows that equities and bonds also experienced sharp volatility increases in March — this was not a gold-specific phenomenon but a broader market stress event. When gold sold off during the GFC, it was not because the metal had become structurally impaired, but because it was one of the few assets investors could easily liquidate to meet margin calls elsewhere. That same dynamic — selling the liquid to fund the illiquid — appears to have been at work again.
Cross-asset annualised volatility comparison
Monthly data. Showing gold, S&P 500, US Aggregate bonds, and energy during selected stress periods.
Source: Bloomberg, ICE Benchmark Administration, World Gold Council. Based on LBMA Gold Price PM, S&P 500 TR, Bloomberg US Agg TR, Bloomberg Energy Subindex, USD Index.
Liquidity: deep water, not shallow
Perhaps the most compelling rebuttal to structural-impairment concerns is the volume data. During the final week of January, as gold prices corrected, total daily trading volumes across major venues — including LBMA over-the-counter activity, COMEX futures, Shanghai Futures Exchange, and global ETF markets — reached US$965bn per day, equivalent to approximately 5,800 tonnes. This was the highest level ever recorded. OTC activity alone averaged US$395bn per day, up 41% week-on-week, while ETF trading surged 137%.
A similar pattern emerged in March. Average daily volumes rose to US$525bn, up 11% month-on-month and 46% above the full-year 2025 average of US$361bn. Far from signalling dysfunction, these figures underscore the operational logic that has long underpinned gold's role as a portfolio anchor: it is precisely during stress events that investors rely on gold's deep two-way liquidity, and precisely during those events that this liquidity has been most evident.
Weekly average daily volumes (US$bn). OTC, Exchange-traded, and ETF segments.
Gold trading volumes by segment during recent pullbacks
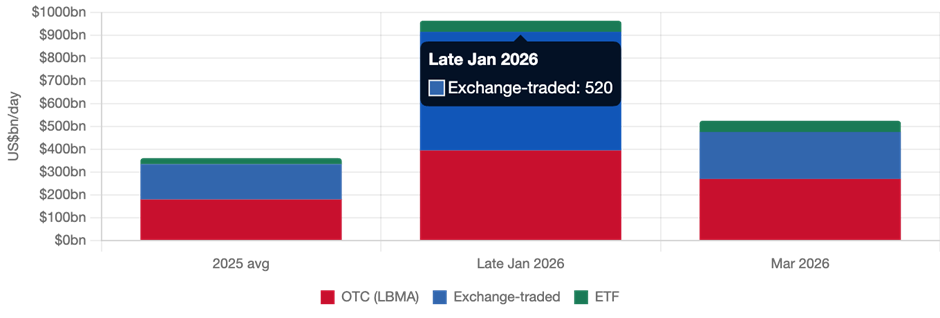
Source: Bloomberg, COMEX, ICE Benchmark Administration, Shanghai Gold Exchange, ETF providers, World Gold Council. Weekly data as of 27 March 2026.
The bid-ask spread picture is more nuanced but ultimately reassuring. Intraday spread data reveals several sharp spikes since late 2024, but four key features contextualise these: the largest episodes occurred either on Sunday night into Monday morning or late Thursday into Friday — the thinnest liquidity windows in the global trading calendar — and they normalised rapidly once standard trading hours resumed. When spreads are adjusted for the prevailing level of realised volatility, they remain broadly within their historical range. The widening was driven by higher volatility, not by dealers stepping away from the market.
The portfolio case: gold in a world of positive bond-equity correlation
For long-term investors, the more strategically significant question is not whether gold's volatility has risen — it has — but whether its portfolio properties have changed. Here the data is unambiguous: they have not.
The defining feature of the current macro environment is the re-emergence of positive bond-equity correlation. When inflation shocks dominate, both asset classes suffer simultaneously, hollowing out the diversification benefit that has been central to traditional 60/40 portfolio construction for two decades. The re-escalation of Middle Eastern conflict and the associated spike in oil prices are likely to sustain inflation-related volatility, maintaining pressure on this correlation.
Gold's correlation with equities, by contrast, has remained consistently low and negative throughout the period. Analysis of a hypothetical global 60/40 portfolio — allocated between MSCI World equities and Bloomberg Global Aggregate bonds — shows that a 5% allocation to gold between January 2025 and April 2026 would have reduced overall portfolio volatility while contributing only minimally to the portfolio's risk budget. The arithmetic is straightforward: even at elevated absolute volatility levels, gold's low covariance with other assets means its addition reduces the variance of the whole.
Effect of 5% gold allocation on portfolio volatility, Jan 2025 – Apr 2026
Hypothetical global 60/40 portfolio (MSCI World / Bloomberg Global Agg). Risk contribution calculated by weighted covariance method.
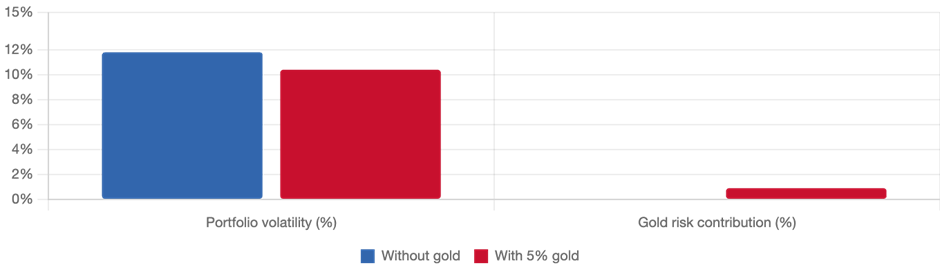
Source: Bloomberg, World Gold Council. Weekly data 1 Jan 2025 – 10 Apr 2026. Portfolio: MSCI World 60%/57.5%, Bloomberg Global Agg 40%/37.5%, Gold 0%/5%.
Outlook: normalisation, not elimination
The balance of evidence points toward a normalisation of gold's volatility over the coming months, assuming the macro environment does not deliver a further exogenous shock of similar magnitude. The mean-reversion dynamic is statistically robust, and the triggers that drove the initial surge — stretched positioning, stop-loss clustering, and specific geopolitical catalysts — are not permanent features of market structure.
What has genuinely changed is the context in which gold operates. The post-pandemic world of persistently higher inflation, geopolitically driven commodity shocks, and a reconfiguring of the bond-equity relationship has, if anything, enhanced the strategic rationale for gold. An asset that provides deep liquidity during market dislocations, maintains low correlation with conventional risk assets, and has a demonstrated track record of recovering strongly once acute stress passes is more valuable in this environment, not less.
For investors tempted to reduce gold allocations in response to short-term volatility data, the historical precedent is clear: those who sold gold during the GFC or the COVID-19 crisis and failed to reinstate positions missed the subsequent recoveries that vindicated gold's long-term role. The current episode, on the available evidence, belongs to the same category of temporary turbulence rather than structural change.


 Please wait processing your request...