Goldman Sachs remains one of the most closely watched financial stocks, and its latest price action combined with strong first-quarter 2026 earnings places the stock at a critical juncture. The chart provided (1-year daily timeframe) highlights a stock that has enjoyed a sustained uptrend but is now facing near-term resistance and consolidation, even as fundamentals remain robust.
📊 Technical Analysis: Trend Losing Momentum?
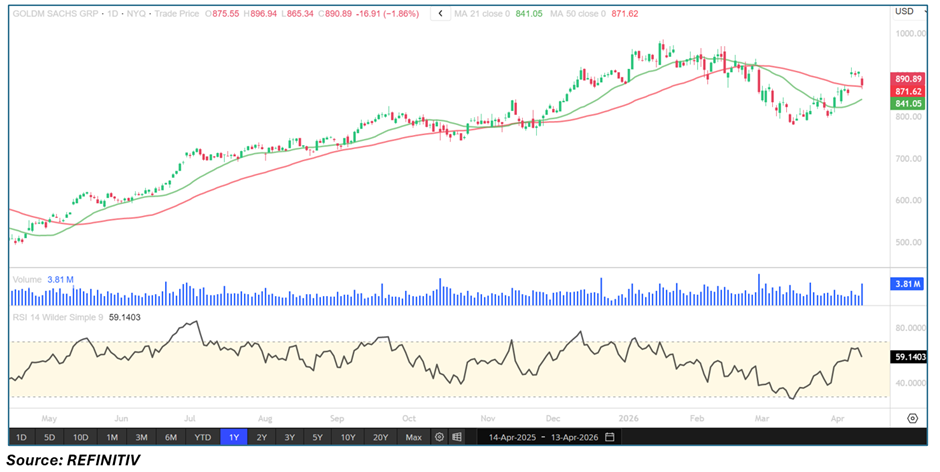
Over the past year, GS has maintained a clear upward trajectory, supported by higher highs and higher lows. However, recent price action suggests a pause in bullish momentum:
- The stock is currently trading near $890, below its recent peak range of $950–$980.
- It is hovering just above the 21-day moving average (~$841) and close to the 50-day moving average (~$871).
- This indicates a short-term consolidation phase, with price compressing between key moving averages.
🔑 Key Levels to Watch
- Immediate Support: $870 (50-day MA)
- Stronger Support: $840 (21-day MA + prior base)
- Major Support: $800 psychological level
- Immediate Resistance: $900–$910
- Major Resistance: $950–$980 (recent highs)
A decisive move below $870 could trigger further downside toward $840, while a break above $910 may signal renewed bullish momentum.
📉 Momentum & Volume Signals
- RSI (~59) reflects a neutral-to-bullish stance, suggesting room for upside but no strong breakout signal yet.
- Volume trends show sporadic spikes during declines, indicating some institutional selling pressure near highs.
Overall, the technical setup suggests indecision, with the stock awaiting a catalyst—likely earnings-driven sentiment or broader market direction.
💰 Earnings Analysis: Strong but Not Enough?
Goldman Sachs delivered a solid Q1 2026 earnings performance, beating expectations and demonstrating resilience across key business segments.
📌 Headline Numbers
- EPS: $17.55 (beat estimates by 7.4%)
- YoY EPS Growth: +4.3% (from $14.12)
- Net Income: $5.40 billion (+18% YoY)
- Revenue: $17.23 billion (+14.4% YoY, beat estimates by 1.5%)
Despite these strong numbers, the stock fell nearly 4% in early trading, suggesting that expectations were already high or investors are concerned about forward-looking risks.
📊 Segment Performance Breakdown
🟢 Global Banking & Markets (Core Driver)
- Revenue: $12.74 billion (+19% YoY)
- Strength driven by:
- Equities revenue: Record $5.33 billion (+27%)
- Investment Banking fees: $2.84 billion (+48%)
- Advisory fees: +89% (boosted by strong M&A activity)
This segment was the standout performer, benefiting from market volatility and increased dealmaking.
However, there were weak spots:
- Fixed Income, Currencies & Commodities (FICC): $4.01 billion (-10% YoY)
🟢 Asset & Wealth Management
- Revenue: $4.08 billion (+10% YoY)
- Growth driven by:
- Higher management fees
- Increased assets under supervision
- Assets under supervision hit a record $3.65 trillion, with strong inflows:
- $87 billion total net inflows
- $62 billion long-term inflows
This reflects strong client confidence and steady fee-based income growth, a key stabilizing factor for Goldman.
🔴 Platform Solutions (Weak Spot)
- Revenue: $411 million (down from $610 million)
- Decline due to markdowns tied to the Apple Card loan portfolio transition
This segment continues to be a drag on overall performance.
💸 Costs & Profitability
- Operating Expenses: $10.43 billion (+14% YoY)
- Increase driven by:
- Higher compensation
- Increased transaction-based costs
- Efficiency Ratio: 60.5% (stable YoY)
- Return on Equity (ROE): 19.8% (strong profitability indicator)
While revenues are growing, rising costs are limiting margin expansion, a key concern for investors.
⚠️ Credit & Risk Factors
- Provision for Credit Losses: $315 million (up from $287 million)
- Increase linked to wholesale loan growth and impairments
Though not alarming, this indicates gradually rising credit risk, especially in a higher-rate environment.
🏦 Balance Sheet & Capital Strength
- Total Assets: $2.06 trillion (up from $1.81 trillion)
- Deposits: $561 billion (up from $501 billion)
However, capital ratios declined:
- CET1 Ratio: 12.5% (down from 14.3%)
- Leverage Ratio: 4.6% (down from 5.2%)
Goldman returned $6.38 billion to shareholders, including:
- $5 billion in share buybacks
- $1.38 billion in dividends
This reflects confidence in capital strength, despite slight declines in ratios.
⚖️ Technical + Fundamental Outlook
🟢 Bullish Case
- Strong earnings growth and revenue beats
- Record performance in equities trading
- Robust M&A and advisory pipeline
- Price holding above $870 support
🔴 Bearish Case
- Rising expenses and credit costs
- Weakness in FICC and Platform Solutions
- Declining capital ratios
- Technical resistance near $900–$910
🧠 Final Take
Goldman Sachs presents a classic divergence scenario: strong fundamentals but cautious price action. While earnings highlight resilient growth, strong dealmaking, and record equities revenue, the stock’s inability to break higher suggests investor skepticism about sustainability.
Technically, GS is at a critical inflection point. A breakout above $910 could reignite the uptrend, while a breakdown below $870 may trigger deeper correction toward $840.
In the near term, price action around key support and resistance levels will be crucial, as markets digest whether Goldman’s strong earnings momentum can continue in a shifting macroeconomic environment.


 Please wait processing your request...