
A brutal downtrend, a Capitulation bottom, and an early-stage recovery attempt — HIMS is at a critical inflection point that demands both attention and caution
Key Highlights
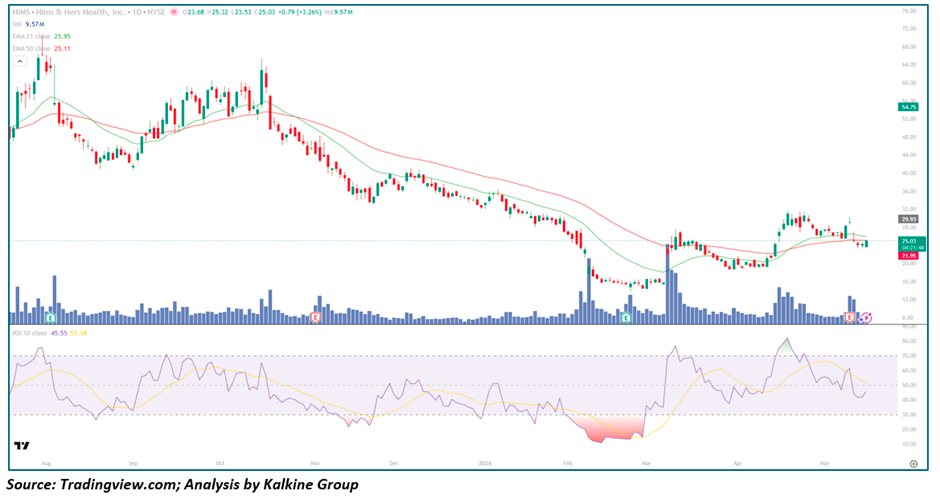
- Hims & Hers Health (NYSE: HIMS) is trading at $25.03, up +$0.79 (+3.26%), with elevated Volume of 9.57M
- Stock has collapsed more than 60% from its August 2025 peak of ~$66, one of the most severe drawdowns among NYSE-listed healthcare names
- EMA-21 ($25.95) and EMA-50 ($25.11) are converging tightly — a critical juncture that will determine near-term direction
- Price is trading between the two EMAs — a neutral no-man's-land reflecting genuine uncertainty
- RSI-10 at 45.55 — below the neutral 50 line, with signal at 51.18, confirming momentum has not yet turned decisively bullish
- The most recent Earnings event (E) has triggered a notable volume surge — a potential catalyst for trend resolution
Trend Structure: A Prolonged Downtrend Meets Its First Real Test
HIMS's chart is a sobering study in what happens when a high-growth, high-multiple consumer health stock meets a sustained derating cycle.
From August 2025, the stock traded near peak valuations around $64–$66, supported by strong subscriber growth narratives in its telehealth and GLP-1 compounding businesses. The EMA-21 and EMA-50 were rising steeply, and momentum was firmly in the bulls' hands.
The rot set in through November 2025 — a breakdown below both moving averages triggered a cascade of selling that would not relent for nearly four months. The decline was not a volatile, choppy affair but a grinding, relentless downtrend, with every attempted rally failing at the declining EMAs and each new low confirming seller control. This is the most dangerous type of downtrend — orderly, institutional, and driven by fundamental re-rating rather than panic.
The February 2026 capitulation low near $15–$16 — marked by an extreme RSI washout into deeply oversold territory (the red-shaded RSI zone clearly visible on the chart) and a massive volume spike — represents the first credible evidence of seller exhaustion. From that point, a sharp recovery to $29–$30 followed, but the stock has since been unable to sustain those gains, pulling back to the current $25 level where the converging EMAs present the moment of truth.
The Catalysts: Why HIMS Is Moving
GLP-1 Compounding Regulatory Overhang The primary driver of HIMS's derating was the FDA's decision regarding compounded semaglutide — threatening a significant Revenue stream that the market had heavily priced in. This regulatory uncertainty has weighed persistently on valuation multiples.
Earnings Event — Critical Inflection The most recent earnings marker (E) visible at the far right of the chart has coincided with a volume surge and a +3.26% gain — suggesting the market may be finding incremental reasons for optimism, whether from subscriber retention data, cost discipline, or updated guidance.
Oversold Mean Reversion Bid After falling more than 60%, HIMS has attracted value-oriented and mean-reversion buyers who see the selloff as excessive relative to the underlying subscription Business fundamentals.
Telehealth Secular Demand Despite the GLP-1 headwind, HIMS's core business addressing men's and women's health conditions via digital-first delivery remains a structurally growing market with high customer lifetime value potential.
Moving Averages: Convergence at a Critical Decision Point
- EMA-21 ($25.95) — flat to mildly declining, acting as immediate overhead resistance
- EMA-50 ($25.11) — beginning to flatten after a prolonged downslope, suggesting selling momentum is decelerating
The convergence of EMA-21 and EMA-50 within less than $1 of each other — with price sandwiched between them — is a technically significant moment. A clean daily close above $25.95 would mark the first time in months that HIMS reclaims both moving averages, a potential early signal of trend change. Failure here risks another leg lower toward the $20–$21 support zone.
Momentum & Volume: Recovering But Not Yet Confirmed
The RSI-10 at 45.55 — with its signal line at 51.18 — tells an honest story: momentum has recovered meaningfully from the February extreme lows, but has not yet crossed into the bullish zone above 50. The signal line sitting above the RSI line is a mild near-term concern, suggesting some loss of recovery momentum in recent sessions.
Volume at 9.57M is notably elevated — well above the baseline — and is the most encouraging near-term signal on the chart. High-volume sessions at this price level suggest genuine institutional interest in determining whether $25 is a base or merely a pause.
Key Technical Levels and Scenarios
Resistance Levels
- $25.95 — EMA-21, immediate overhead resistance and trend-change trigger
- $29–$30 — Recent recovery high and key Supply zone
- $36–$38 — Medium-term resistance from the prior downtrend structure
- $44–$46 — Major structural resistance — the breakdown zone from late 2025
Support Levels
- $25.11 — EMA-50, immediate dynamic support
- $21–$22 — Recent consolidation floor and key near-term support
- $15–$16 — February capitulation low — the ultimate line in the sand
Scenarios
- Bullish Recovery (Conditional Case) A decisive close above the EMA-21 ($25.95) on sustained volume triggers a technical trend-change signal, opening the path toward the $29–$30 resistance zone. A break above $30 would materially improve the medium-term outlook and attract momentum buyers back into the name.
- Sideways Consolidation (Base-Building Case) HIMS oscillates between $22–$28 for several weeks, gradually compressing Volatility and allowing the moving averages to flatten and converge. This would be constructive for a longer-term base formation, even if frustrating for near-term traders.
- Failure and Retest (Risk Case) Price fails to hold above the EMA-50 ($25.11), rolls over, and retests the $21–$22 support zone. Given the broader downtrend structure is not yet broken, this remains a material risk and cannot be dismissed.
The Bear Case: Structural Damage Requires More Than a Bounce to Repair
HIMS carries meaningful structural baggage that bulls must acknowledge:
- The 60%+ decline has destroyed significant technical support levels that will now act as overhead resistance on any recovery
- Regulatory Risk around GLP-1 compounding remains unresolved and could reassert itself with any adverse FDA communication
- The RSI has not yet crossed 50 on a sustained basis since the recovery began — every rally has faded before confirming a genuine trend change
- The converging EMAs are still pointing downward — trend confirmation requires both price and averages to inflect upward together
- High retail participation (evidenced by volume spikes at emotional extremes) adds to the likelihood of continued volatility rather than orderly recovery
Conclusion: Intriguing Turnaround Setup, But Evidence Required Before Conviction
Hims & Hers Health is at one of the most consequential technical junctures in its listed history. The capitulation low is in place, the moving averages are converging, and elevated volume is suggesting that the market is actively reassessing the stock's value proposition.
But the evidence for a confirmed trend Reversal is not yet present. RSI below 50, price trapped between the EMAs, and a bearish macro overhang from regulatory risk mean that patience and proof — not anticipation — should drive decision-making here.
The decisive entry trigger is a clean close above $25.95 (EMA-21) on strong volume, ideally accompanied by an RSI cross above 50. Until that occurs, the risk/reward favors watching over acting.
For those with higher Risk tolerance, the $21–$22 zone offers a defined-risk long entry with the February low as a clear stop reference. For everyone else, HIMS is a compelling watchlist name — with $30 as the first target and $36–$38 the medium-term bull case — waiting for the chart to prove the worst is behind it.


 Please wait processing your request...