
Key Highlights
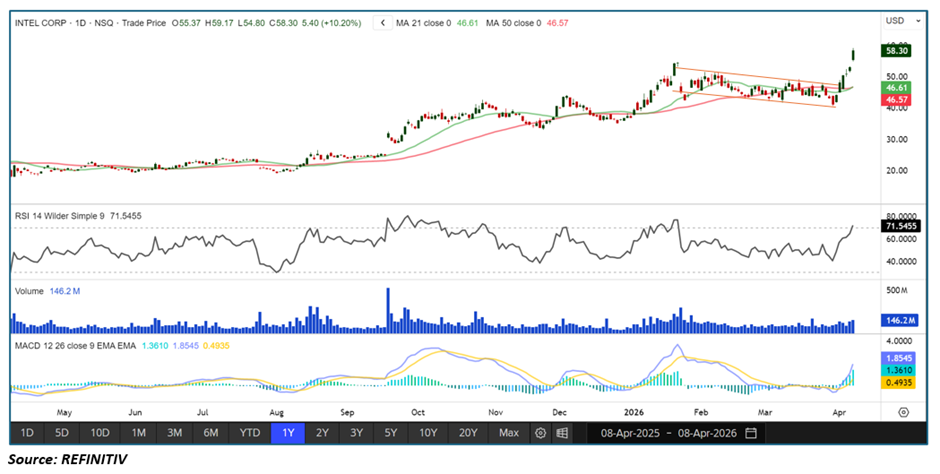
• Intel Corporation (INTC) has broken out of a descending channel pattern, indicating a potential trend reversal
• Price action has gained momentum post-breakout, supported by strong bullish candles
• The 14-period RSI is trending higher and moving into bullish territory, reflecting improving momentum
• MACD has turned positive, with the histogram expanding, signaling strengthening upside momentum
• Immediate resistance is seen near the $60 level, while support is now established around $50–$52
Trend Structure: Breakout Marks Shift in Market Sentiment
Intel’s recent price action reflects a notable shift in its broader trend structure. After trading within a descending channel for several weeks, the stock has decisively broken above the upper boundary of this pattern. Such breakouts are often considered early indicators of a trend reversal or the beginning of a new bullish phase.
The breakout is supported by strong follow-through buying, suggesting that market participants are increasingly confident in the stock’s upside potential. Additionally, the formation of higher highs and higher lows post-breakout reinforces the transition from a corrective phase to a potential uptrend.
Importantly, this move signals that sellers who previously controlled the channel are losing dominance, while buyers are stepping in more aggressively. As long as the price sustains above the breakout zone, the bullish structure is likely to remain intact.
Price Action: Strong Follow-Through Above Channel Resistance
Following the channel breakout, Intel has drifted higher with steady momentum. The price action reflects a controlled and sustainable rally rather than a sharp, overextended spike.
Key observations include:
• Breakout supported by strong bullish candles
• Sustained trading above the previous resistance zone
• No immediate signs of exhaustion or rejection at higher levels
This type of price behavior typically indicates accumulation rather than speculative buying. The absence of sharp pullbacks suggests that dips are being bought into, reinforcing the bullish bias.
If the stock continues to hold above the breakout level, it increases the probability of a continued move toward higher resistance zones.
RSI Momentum: Strengthening Bullish Bias
The Relative Strength Index (RSI) is providing a strong confirmation of the improving momentum. Currently trending higher and moving above the midpoint (50 level), RSI indicates that buying pressure is gaining strength.
Key RSI signals:
• Sustained move above the midpoint reflects bullish momentum
• Gradual rise suggests steady accumulation rather than overheating
• No immediate signs of bearish divergence
A rising RSI in conjunction with a price breakout is typically a strong bullish signal. It suggests that momentum is aligned with price action, increasing the likelihood of trend continuation.
If RSI continues to move toward the overbought zone (above 70), it would further confirm strong bullish sentiment, though it may also signal short-term consolidation later.
MACD Analysis: Positive Crossover Supports Upside
The Moving Average Convergence Divergence (MACD) indicator has turned positive, adding another layer of confirmation to the bullish outlook.
Current MACD observations:
• MACD line has crossed above the signal line
• Histogram has turned positive and is expanding
• Momentum is accelerating in favor of buyers
An expanding positive histogram typically indicates increasing momentum, which often precedes further price gains. This alignment between MACD and price action strengthens the case for continued upside in the near term.
Moving Average Structure: Dynamic Support Emerging
Intel’s price is now trading above key moving averages, which are beginning to act as dynamic support levels.
- The 21-period SMA is trending higher, supporting short-term momentum
• The 50-period SMA, previously acting as resistance, is now likely to turn into support upon a successful retest
This shift in moving average behavior is significant. When resistance levels convert into support, it often attracts additional buying interest, particularly from institutional participants.
As long as the stock holds above these moving averages, the underlying trend structure remains constructive.
Market Structure: Breakout Followed by Continuation Phase
The current setup suggests that Intel may be entering a continuation phase following its breakout. Typically, after a channel breakout, markets either:
• Continue trending higher with strong momentum, or
• Consolidate briefly before the next leg up
Given the current momentum indicators and volume support, the probability leans toward continued upside, with minor consolidations along the way.
Such consolidation phases, if they occur, are likely to be shallow and short-lived, as buyers step in to capitalize on dips.
Key Technical Levels & Targets
- Immediate Resistance: $60
• Next Upside Target: $62–$65 zone
• Key Support: $50–$52 (previous breakout zone)
• Major Support: Near the 50-period SMA
A sustained move above the $60 level could open the door for a sharper rally toward the $62–$65 range. On the downside, holding above $50 is crucial to maintain the breakout structure.
Key Technical Scenarios
- Bullish Continuation (Primary Scenario)
• Price sustains above breakout zone
• RSI continues trending higher
• MACD histogram expands further
• Stock moves toward $62–$65 - Short-Term Consolidation
• Price trades sideways near current levels
• RSI stabilizes without sharp decline
• Breakout level acts as strong support - Pullback to Retest Support
• Price retraces toward $50–$52
• Moving averages provide support
• Buyers step in at lower levels
Risk Considerations
While the setup remains bullish, certain risks should be monitored:
• Failure to hold above the breakout zone could weaken sentiment
• A sharp RSI reversal may indicate momentum loss
• MACD flattening could signal slowing upside momentum
• Broader market weakness may impact stock performance
Conclusion: Breakout Strength Positions Intel for Further Gains
Intel has successfully broken out of a descending channel, signaling a potential shift toward a bullish trend. The move is well-supported by rising RSI and a positive MACD crossover, both of which indicate strengthening momentum.
With price holding above key support levels and moving averages turning supportive, the stock appears well-positioned for further upside. If momentum sustains, Intel could target the $60 mark and potentially extend gains toward the $62–$65 range.
Overall, the technical structure reflects a bullish bias, with the breakout acting as a strong foundation for continued upward movement in the near term.


 Please wait processing your request...