
Summary
Netflix's daily chart presents a textbook bearish technical setup at a critical juncture. Following a 3.44% decline to close at 88'0, the stock is now trading below all four key exponential moving averages — the 20 (94'0), 50 (94'2), 100 (95'5), and 200 (98'5) — while simultaneously failing at the upper boundary of a well-defined descending channel that has contained price action since the July 2025 peak. RSI on the 14-period close prints at 34.15, approaching but not yet confirming oversold territory, while the signal line at 44.22 has crossed decisively below the midline. The weight of evidence is bearish. Structural support at the 86–87 zone represents the final technical line before a potential re-test of the December 2025 lows near 76–78.
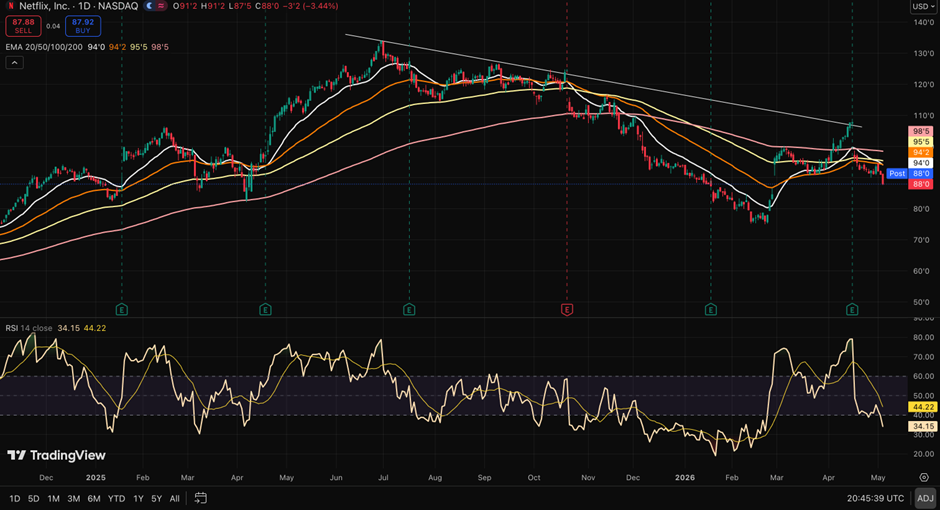
NFLX’s Daily Price Chart. Source: tradingview.com, Analysis by Kalkine Group
Price Structure: The Descending Channel
The most dominant feature on the chart is the clearly defined descending channel drawn from the June–July 2025 peak around 128–130. Both the upper resistance trendline and the lower support trendline are well-tested, with multiple touches confirming the structure's validity across an approximately eleven-month timeframe.
Price staged a meaningful recovery from the February 2026 lows — a rally that briefly pushed NFLX above the 94–95 zone in late March and into April, generating what appeared to be a channel breakout attempt. That attempt has now failed decisively. Tuesday's session saw the stock reject the descending channel's upper boundary with authority, closing back inside the channel at 88'0 after tagging an intraday high of 91'2. The rejection candle — a bearish close well off session highs — is a high-conviction reversal signal at a technically significant level.
The implication is clear: sellers are positioned at the channel top, the breakout was a false move, and price has now re-entered the dominant bearish structure that has been in place since summer 2025. From a trend-following perspective, the path of least resistance is lower.
EMA Configuration: Bearish Stack in Full Effect
The EMA configuration confirms what the price structure implies. All four EMAs — 20, 50, 100, and 200 — are in a bearish sequential stack, with each shorter-term average trading below the longer-term one. The 20 EMA at 94'0 sits below the 50 at 94'2, which sits below the 100 at 95'5, which sits below the 200 at 98'5. Price at 88'0 is beneath all four.
This full bearish EMA stack is not merely a current-state observation — it is a regime indicator. When price is below all four EMAs in this configuration, mean-reversion rallies tend to be sold aggressively at each successive EMA level. The 20/50 cluster in the 94–95 zone now represents the nearest overhead resistance, followed by the 100 at 95'5 and the long-term 200 at 98'5. Each of these levels is a potential supply zone where short sellers will add and longs will exit.
The convergence of the 20 and 50 EMAs at virtually identical levels — 94'0 and 94'2 respectively — creates a compressed resistance band that will take a significant volume-driven catalyst to penetrate convincingly. The failed breakout attempt in March–April essentially used up the momentum that might have achieved that penetration. The stock is now retreating from that band with the EMAs beginning to roll over.
RSI Analysis: Weakness Without Oversold Capitulation
The RSI picture adds important nuance to the bearish setup. The 14-period RSI on close prints 34.15 — below the midline and approaching the 30-level oversold threshold, but not yet there. The signal line at 44.22 has crossed below the midline and is declining, confirming the momentum deterioration visible in the price action.
The critical observation here is the absence of bullish divergence. In the December 2025 to February 2026 recovery cycle, RSI formed a constructive base that corresponded with the price low, helping to fuel the subsequent rally. At present, RSI is declining in tandem with price — a momentum alignment that argues against a near-term low being in place.
For a tradeable bottom to develop, technicians would want to see either RSI reach and hold the 30 level with a bullish divergence (price making new lows while RSI makes higher lows) or a volume-driven capitulation spike that exhausts sellers in a single session. Neither condition is present today.
The RSI setup, in short, suggests the selloff has further to run before a durable technical base can form.
Key Levels and Trade Framework
Resistance: 91'2 (today's high / channel top), 94–95 (20/50 EMA compression zone), 95'5 (100 EMA), 98'5 (200 EMA).
Support: 86–87 (horizontal support, dotted blue line visible on chart), 80–81 (prior consolidation), 76–78 (December 2025 lows — the structural floor).
Tactical View: The rejection at the channel top, full bearish EMA stack, declining RSI without oversold divergence, and post-earnings price weakness combine to argue for a short bias on tactical timeframes. Any rally toward the 91–92 zone that fails to reclaim the channel boundary with volume should be treated as a selling opportunity. A daily close above 95'5 on above-average volume would materially change the near-term picture and require reassessment.
Risk Disclosure: This analysis is for informational purposes only and does not constitute investment advice. Past technical patterns are not predictive of future price movements. All levels cited are approximate and drawn from the chart as of May 6, 2026.
The chart is telling a consistent story across every analytical dimension — structure, trend, momentum, and EMA configuration. Until NFLX reclaims 95'5 on a closing basis, the technical case for the bears remains firmly intact.


 Please wait processing your request...