Image source: © 2025 Krish Capital Pty.Ltd
Highlights
- PPRUF’s FY24 sales and other operating revenue fell by 12.1% YoY to EUR 17,194.00 million.
- The company recorded a 59.7% YoY drop in net income, while operating cash flow rose 5.6%.
- PPRUF issued a EUR 750 million bond to strengthen liquidity amid a stable credit outlook.
Kering SA (OTC: PPRUF) is a France-based luxury group managing renowned brands across fashion, leather goods, jewellery, eyewear, and beauty, including Gucci, Saint Laurent, Bottega Veneta, and Balenciaga.
In the financial year 2024 (FY24), the company’s sales and other operating revenue fell by 12.1% YoY to EUR 17,194.00 million due to market conditions and macroeconomic headwinds. Net income declined by 59.7% YoY to EUR 1,237.0 million due to decreased revenues as well as increased reported expenses. However, net operating cash flow increased by 5.6% YoY to EUR 4,709.00 million, driven by higher non-cash expenses and the favourable impact of changes in net working capital, resulting in a 10.3% YoY decline in total cash and cash equivalents to EUR 3,518.00 million.
Recent Business Update
Kering (PPRUF) issued a EUR 750 million 4.5-year bond with a 3.125% coupon to support liquidity management, with decent investor demand reflecting confidence in the company’s BBB+ credit rating and credit profile.
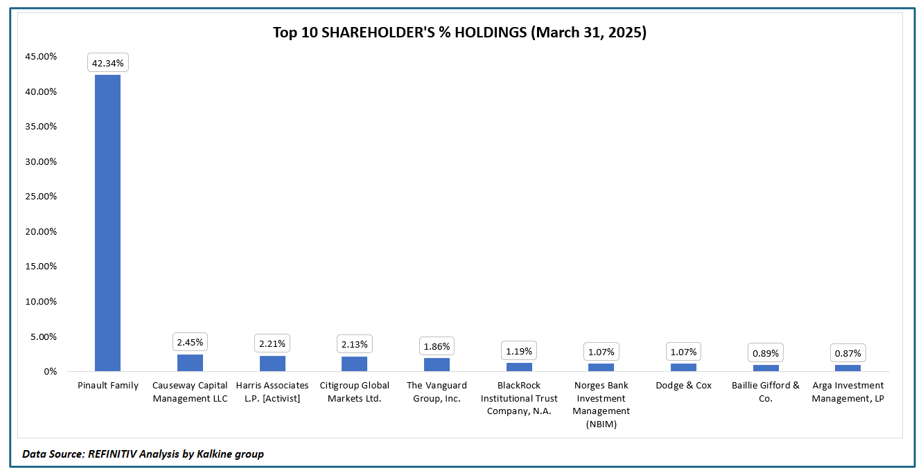
Top 10 Shareholders
The top 10 shareholders collectively account for approximately 56.08% of the total ownership, with the Pinault Family and Causeway Capital Management LLC holding the largest stakes at around 42.34% and 2.45%, respectively.
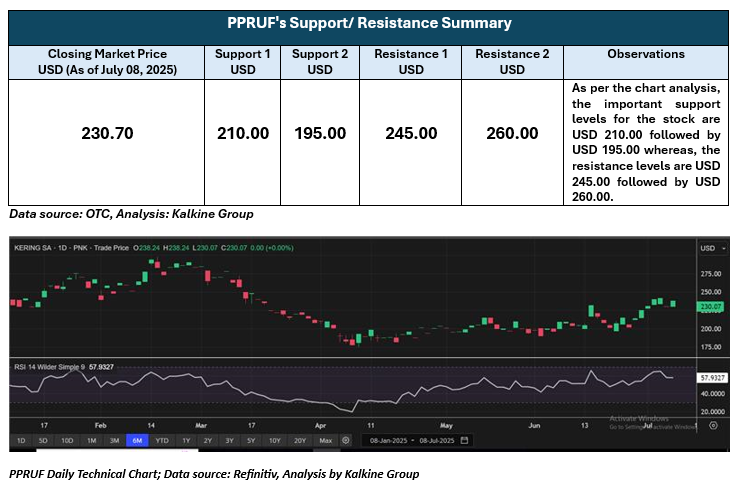
Stock Information
The stock has recorded an increase of approximately 17.20% over the past month and a decline of around 5.14% over the past six months. Moreover, it is trading above the average 52-week high price of USD 379.89 and 52-week low price of USD 174.62, with a closing price at USD 230.07 as of July 08, 2025.
Note 1: Past performance is not a reliable indicator of future performance.
Note 2: The reference data for all price data, currency, technical indicators, support, and resistance levels is July 08 2025. The reference data in this report has been partly sourced from EODHD/Others.
Technical Indicators Defined
Support: A level at which the stock prices tend to find support if they are falling, and a downtrend may take a pause backed by demand or buying interest. Support 1 refers to the nearby support level for the stock and if the price breaches the level, then Support 2 may act as the crucial support level for the stock.
Resistance: A level at which the stock prices tend to find resistance when they are rising, and an uptrend may take a pause due to profit booking or selling interest. Resistance 1 refers to the nearby resistance level for the stock and if the price surpasses the level, then Resistance 2 may act as the crucial resistance level for the stock.


 Please wait processing your request...