
Key Highlights
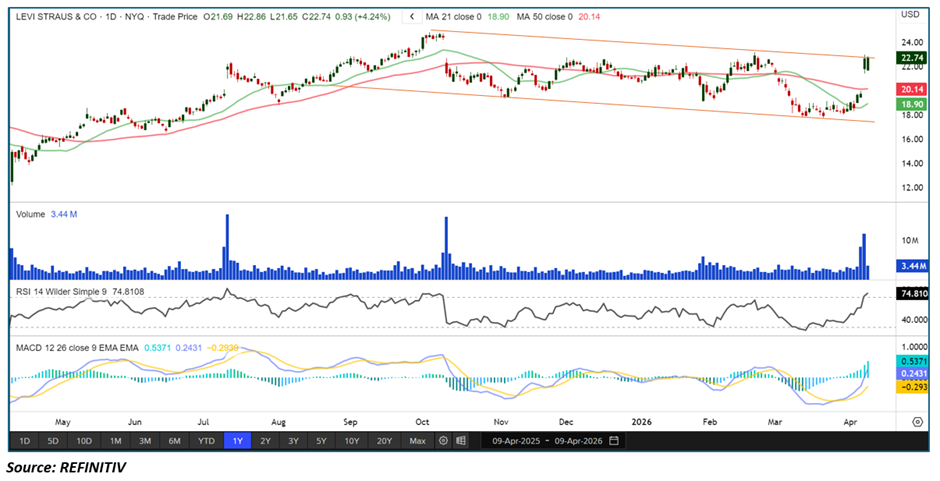
- Levi Strauss & Co. (LEVI) is hovering near the upper band of a falling channel, indicating a critical resistance zone
• The stock has witnessed a breakout backed by strong volume, signaling strong buying interest
• Price is trading above both the 21-period and 50-period SMAs, reflecting a strengthening trend structure
• The RSI is in overbought territory, highlighting strong momentum but also caution for short-term pullbacks
• The MACD indicator is positive, confirming bullish momentum
Trend Structure: Falling Channel Breakout Signals Trend Reversal
Levi Strauss had been trading within a falling channel, characterized by lower highs and lower lows, indicating a sustained downtrend. However, the recent price action marks a significant shift.
The stock has approached and broken above the upper boundary of the channel, which is a key technical development.
This breakout suggests:
• The prior downtrend is losing strength
• Buyers are gaining control
• Potential transition from bearish to bullish structure
A sustained move above the channel often marks the beginning of a new upward leg, as it signals a structural change in market sentiment.
Price Action: Breakout Backed by Strong Volume
LEVI has demonstrated strong price action, with the breakout supported by a noticeable surge in trading volume. This is a critical confirmation signal.
Key observations:
• Strong bullish candles near resistance
• Breakout above channel resistance
• Volume expansion indicating institutional participation
Volume-backed breakouts tend to be more reliable and often lead to follow-through buying, increasing the probability of continued upside.
Moving Average Analysis: Bullish Alignment Strengthens
The moving average setup reflects a strong bullish shift:
- 21-period SMA: Price trading above, acting as immediate support
• 50-period SMA: Also below price, reinforcing medium-term support
• Trend implication: Bullish alignment across short- and medium-term averages
Trading above both key moving averages suggests that momentum and trend structure are aligned in favor of buyers.
This alignment often acts as a foundation for sustained rallies, especially when combined with a confirmed breakout.
RSI Momentum: Overbought but Strong
The Relative Strength Index (RSI) has moved into overbought territory (above 70), reflecting strong bullish momentum.
Current RSI signals:
• Elevated levels indicating aggressive buying
• Momentum-driven rally in progress
• Potential for short-term consolidation or pullback
While overbought conditions may lead to temporary pauses, they also indicate that buying pressure is strong, especially during breakout phases.
MACD Indicator: Positive Momentum Confirmed
The MACD indicator is supporting the bullish outlook, with signals firmly in positive territory.
Key signals:
• MACD line above signal line
• Histogram in positive territory
• Momentum accelerating in favor of buyers
This confirms that the uptrend is supported by strong underlying momentum, increasing the likelihood of continuation.
Market Structure: New Bullish Leg Emerging
The current setup suggests that LEVI may be entering a new bullish phase following the breakout. This phase is typically characterized by:
• Breakout above key resistance structures
• Strong volume participation
• Alignment of momentum indicators
A sustained move above the channel could trigger the next leg of the rally, potentially leading to higher highs.
Key Technical Levels & Targets
- Immediate Resistance: Near recent highs post-breakout
• Next Upside Target: Higher resistance zones formed before the downtrend
• Immediate Support: 21-period SMA
• Strong Support: 50-period SMA and previous channel resistance (now support)
Holding above the breakout zone is crucial for maintaining bullish momentum.
Key Technical Scenarios
- Bullish Continuation (Primary Scenario)
- Price sustains above channel breakout
• RSI remains elevated
• MACD stays positive
• Stock continues higher
- Breakout Acceleration
- Strong follow-through buying
• Momentum expands further
• New highs established
- Pullback to Support
- Short-term correction due to overbought RSI
• Retest of breakout zone or 21-SMA
• Uptrend remains intact if support holds
Risk Considerations
- Overbought RSI may trigger short-term consolidation
• Failure to hold above breakout level could lead to a false breakout
• Broader market weakness may impact momentum
• Volume decline could reduce conviction in the move
Conclusion: Breakout Above Channel Signals Start of New Rally Leg
Levi Strauss has delivered a strong technical breakout above the upper band of its falling channel, supported by robust volume and improving momentum indicators. The move above both the 21-period and 50-period SMAs reinforces a bullish trend shift.
While the RSI indicates overbought conditions, the positive MACD and strong price structure suggest that momentum remains firmly in favor of buyers.
If the stock sustains above the breakout zone, it could mark the beginning of a new upward leg, paving the way for further gains in the near term.


 Please wait processing your request...