
Image source: © 2025 Krish Capital Pty.Ltd
Highlights
- LKNCY reported a 41.2% YoY increase in Q1 FY25 net revenue to RMB 8,865.4 million.
- LKNCY opened 1,757 net new stores in Q1 FY25, expanding its total footprint to 24,097 locations
- LKNCY achieved 8.1% same-store sales growth for self-operated stores, reversing a 20.3% decline in Q1FY24.
Luckin Coffee Inc. (OTC: LKNCY) is a China-based holding company that operates a coffee retail business using a new retail model focused on mobile app-driven ordering and pick-up stores, offering freshly brewed beverages, juices, and light meals under its primary brand, Luckin Coffee.
In the first quarter of the financial year 2025 (Q1FY25), the company’s total net revenue increased by 41.2% year-on-year (YoY) to RMB 8,865.4 million, driven by higher revenue from both segments. The company reported a net income of RMB 525.1 million, compared to a net loss of RMB 83.2 million in Q1FY24, due to increased total net revenue partially offset by higher operating expenses. Cash from operating activities was RMB 896.6 million, compared to an outflow of RMB 264.4 million in Q1FY24, reflecting improved net income. However, cash and cash equivalents rose by 4.0% YoY to RMB 4,535.9 million, supported by inflows from operating activities and partially offset by outflows from financing and investing activities.
Recent Business Update
In Q1 FY25, LKNCY added 1,757 net new stores, expanding its network to 24,097 locations across China. The company also recorded an 8.1% same-store sales growth for self-operated stores, reversing a 20.3% decline in Q1 FY24. Additionally, Luckin’s GAAP operating margin improved to 8.3% from negative 1.0% a year earlier, reflecting enhanced profitability and operational efficiency.
Company Outlook
LKNCY enters the remainder of FY25 with an improved financial footing, backed by RMB 6,130.1 million in liquidity and a positive operating cash flow of RMB 896.6 million. This recovery reflects enhanced operational execution and efficient store-level performance following past governance setbacks.
While the company faces elevated sales and marketing expenses and a competitive retail environment, its 8.1% same-store sales growth and continued store expansion underscore momentum in capturing domestic market share. Sustained focus on cost management and transparency will be key to long-term stability.
Stock Information
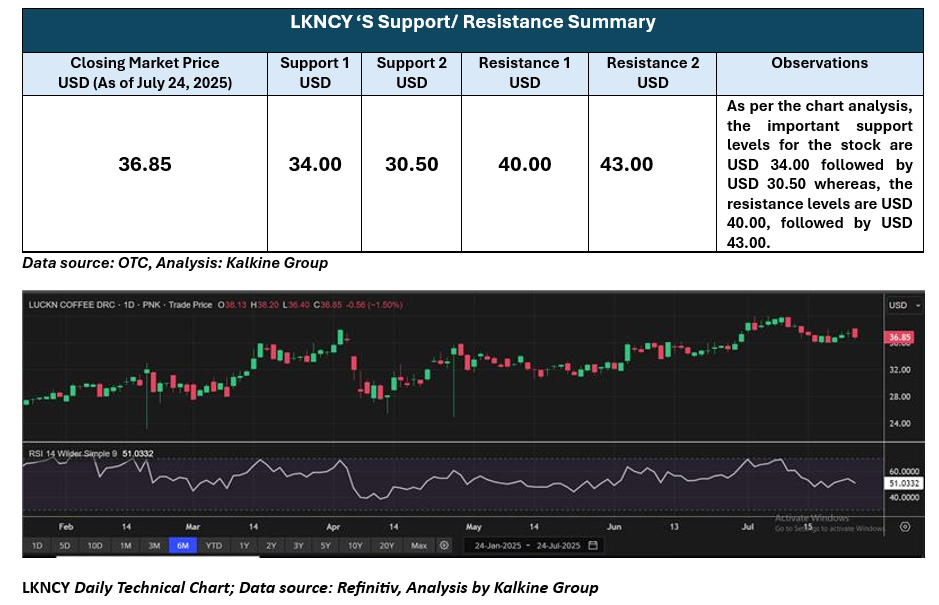
The stock has recorded an increase of approximately 4.39 % over the past month and around 37.5% over the past six months. Moreover, it is trading above the average of its 52-week high price of USD 39.98 and 52-week low price of USD 17.28, with a closing price at USD 36.85 on July 24 2025.
Note 1: Past performance is not a reliable indicator of future performance.
Note 2: The reference data for all price data, currency, technical indicators, support, and resistance levels is 24 July 2025. The reference data in this report has been partly sourced from EODHD/Others.
Technical Indicators Defined
Support: A level at which the stock prices tend to find support if they are falling, and a downtrend may take a pause backed by demand or buying interest. Support 1 refers to the nearby support level for the stock and if the price breaches the level, then Support 2 may act as the crucial support level for the stock.
Resistance: A level at which the stock prices tend to find resistance when they are rising, and an uptrend may take a pause due to profit booking or selling interest. Resistance 1 refers to the nearby resistance level for the stock and if the price surpasses the level, then Resistance 2 may act as the crucial resistance level for the stock.


 Please wait processing your request...