
Key Highlights
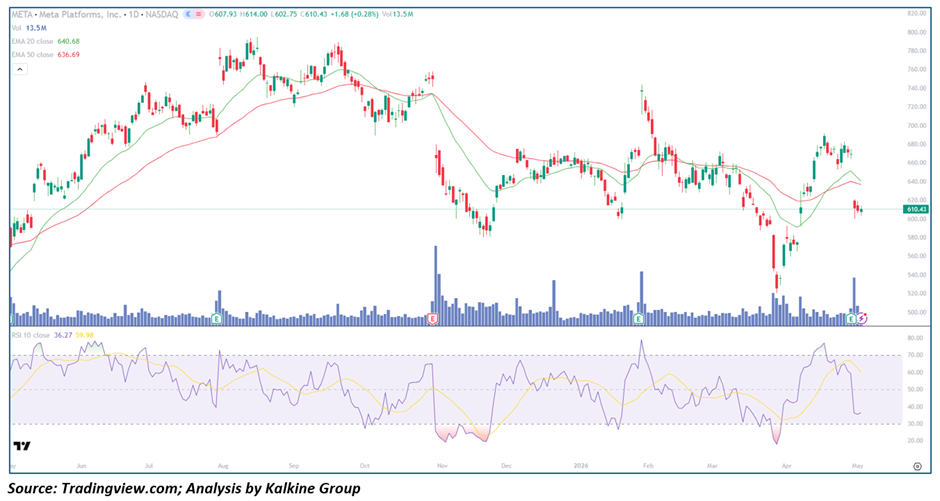
• Meta Platforms, Inc. (NASDAQ: META) is trading around the 610 zone after a sharp recovery from recent lows
• Price remains below the 20-day (~640.68) and 50-day (~636.69) moving averages, indicating weak structure
• RSI near ~36–40 reflects fading momentum after a recent rejection from higher levels
• Volume spikes observed during sharp moves, indicating high participation during volatility phases
• Structure shows wide swings with no clear directional dominance
Trend Structure: Transition Phase with Bearish Bias
META is currently exhibiting a mixed but slightly bearish structure following a volatile period.
Key observations include:
• Lower highs forming after a sharp breakdown
• Failure to sustain above key moving averages
• Choppy recovery attempts lacking follow-through
This suggests:
• Sellers remain active at higher levels
• Trend lacks clear direction
• Market is transitioning rather than trending
The structure reflects a possible range formation within a broader weakening trend.
Price Action: High Volatility with Rejection at Higher Levels
Recent price behavior highlights indecision and sharp swings:
• Strong bounce from sub-560 levels toward 680+
• Sharp rejection from higher zones followed by pullback
• Increased frequency of long wicks and mixed candles
This implies:
• Aggressive two-sided trading
• Lack of sustained buying momentum
• Presence of supply at higher levels
Such action typically signals:
• Range-bound behavior
• Uncertain directional bias
• Potential continuation of sideways movement
Moving Averages: Bearish to Neutral Alignment
The moving average setup reflects weakness:
• Price is currently below both the 20-day and 50-day MAs
• 20-day MA is slightly below the 50-day MA
• Both averages are relatively flat to slightly downward
Interpretation:
• Short-term trend remains weak
• Medium-term trend lacks strength
• Upside attempts may face resistance near averages
Momentum Indicators: Weak Momentum with Recovery Attempts
RSI is currently in the ~35–40 range after a sharp drop.
Key signals:
• Momentum weakened significantly after rejection
• RSI bounced from oversold levels but failed to sustain strength
• No strong bullish divergence confirmed
Interpretation:
• Momentum remains fragile
• Upside lacks conviction
• Risk of further consolidation or downside remains
Volume Analysis: Participation During Volatility Spikes
Volume trends indicate reactive participation:
• High volume during sharp selloffs and rebounds
• No consistent accumulation pattern
• Activity concentrated during key moves
This indicates:
• Traders are reacting to volatility rather than building positions
• No clear institutional accumulation trend
• Market remains event-driven
Market Structure: Range Formation After Breakdown
The broader structure suggests consolidation:
• Breakdown from prior range near 700+
• Attempted recovery failing to sustain
• Price oscillating within a wide band
This combination suggests:
• Neutral to bearish outlook
• Market searching for direction
• Range trading likely in near term
Key Technical Levels and Scenarios
Support Levels
• 600–590 as immediate support
• 560 as strong support zone
• 520 as major downside level
Resistance Levels
• 640–650 as immediate resistance
• 680 as key resistance zone
• 720 as major breakout level
Scenarios
- Range Continuation (Primary Case)
• Price oscillates between 560–650
• No breakout confirmation
• Volume remains inconsistent
• Sideways consolidation persists - Bullish Recovery (Secondary Case)
• Price reclaims 650+ decisively
• Sustains above moving averages
• Momentum improves
• Move toward 680–720 - Bearish Continuation (Risk Case)
• Price breaks below 590
• Selling pressure increases
• Momentum weakens further
• Decline toward 560–520
Conclusion: Volatile Structure with Indecisive Bias
Meta Platforms, Inc. is currently exhibiting a volatile and indecisive structure following a sharp decline and partial recovery. The inability to reclaim key moving averages, combined with weak momentum and rejection at higher levels, suggests that the stock is likely to remain range-bound in the near term. While recovery attempts are visible, the broader structure still leans neutral to bearish unless a decisive breakout above resistance levels occurs.


 Please wait processing your request...