
A strong impulsive rally, clean Fibonacci Retracement support, and price holding above rising moving averages — Nasdaq remains structurally bullish, but near-term consolidation signals a pause before the next move
Key Highlights
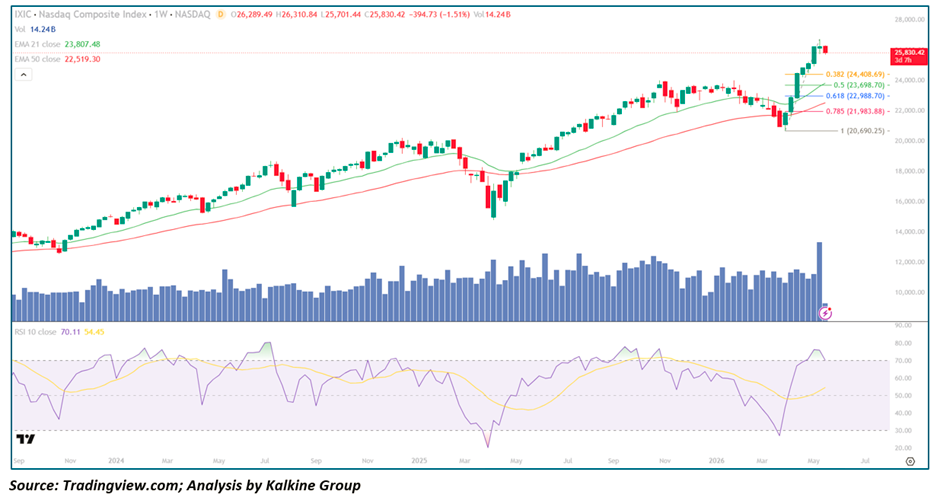
- Nasdaq Composite (IXIC) is trading near 25,830, down ~-1.51% on the week, showing mild profit-taking after a strong rally
• Price has recently completed a sharp bullish impulse leg, followed by a controlled pullback into Fibonacci retracement levels
• The index is holding above key Fib zones: 0.382 (~24,400), 0.5 (~23,700), and 0.618 (~22,980) — confirming strong structural support
• EMA-21 (~23,807) and EMA-50 (~22,519) are both rising and well below price, confirming a strong bullish trend
• Price remains significantly above both EMAs, indicating continuation bias despite short-term weakness
• RSI-10 near 70, recently pulling back from overbought levels — momentum is cooling but still elevated
• Volume expanded during the breakout phase and is stabilizing — suggesting healthy consolidation, not distribution
Pattern Analysis: Bullish Impulse Followed by Fibonacci Pullback
The Nasdaq Weekly Chart reflects a classic trend continuation structure — a strong impulsive rally followed by a measured retracement into Fibonacci support levels before attempting continuation higher.
The move began from the March–April low near ~20,700, which marked a major swing bottom. From there, the index rallied aggressively, forming a near-vertical advance toward the recent highs near ~26,300. This move represents a powerful bullish impulse, supported by strong breadth and participation in growth and AI-driven stocks.
Following this rally, price entered a controlled pullback phase, retracing into key Fibonacci levels:
- 0.382 (~24,400) — shallow pullback, strong trend signal
- 0.5 (~23,700) — equilibrium zone
- 0.618 (~22,980) — deeper retracement but still bullish
Importantly, the pullback respected the 0.382–0.5 zone, indicating that buyers stepped in early — a hallmark of strong trends. There was no deep retracement toward the 0.786 level (~21,980), reinforcing bullish strength.
The current structure suggests that this is not a Reversal but a continuation setup, where the market is digesting gains before another leg higher.
Moving Averages: Strong Bullish Alignment
- EMA-21 (~23,807) — rising steadily, acting as dynamic support during pullbacks
• EMA-50 (~22,519) — trending upward, providing strong structural support
The distance between price and these moving averages highlights the strength of the trend. Unlike weak markets where price hugs or falls below EMAs, Nasdaq is extended above both, indicating strong institutional Demand.
Additionally:
- EMA-21 above EMA-50 → bullish alignment
- Both EMAs sloping upward → trend confirmation
This configuration suggests that dips toward EMA-21 are likely to be bought, while deeper pullbacks toward EMA-50 would represent high-probability accumulation zones.
Momentum: RSI Cooling from Overbought Levels
The RSI-10 recently moved above 70, indicating overbought conditions during the rally phase. However, it has started to cool slightly, now hovering near the overbought threshold.
This behavior is typical in strong trends:
- RSI moves into overbought territory during impulsive rallies
- Then consolidates without collapsing → bullish continuation
Crucially, RSI has not broken down below 50, which would signal a trend shift. Instead, it is stabilizing — suggesting momentum reset rather than reversal.
If the next rally leg begins, RSI could push back above 70, confirming renewed bullish momentum.
Key Technical Levels and Scenarios
Resistance Levels
- 26,300–26,500 — recent swing high zone
• 27,000+ — psychological and breakout extension level
Support Levels
- 24,400 — 0.382 Fibonacci support
• 23,700 — 0.5 retracement level
• 22,980 — 0.618 retracement (strong support)
• 23,800 — EMA-21 dynamic support
• 22,500 — EMA-50 major support
Scenarios
- Bullish Continuation (Primary Case)
Price holds above 24,400–23,700 zone and resumes upward momentum
- RSI stabilizes and turns higher
- Volume expands on breakout
- Targets: 26,500 → 27,500+
👉 This is the highest probability scenario given strong trend + shallow retracement
- Deeper Pullback (Healthy Correction)
Price breaks below 24,400 and tests:
- 23,700 (0.5 Fib)
- Possibly 22,980 (0.618 Fib + EMA-21/50 confluence)
👉 This would still be bullish — offering better long entries
- Trend Weakening (Low Probability)
Break below 22,500 (EMA-50):
- RSI falls below 50
- Structure shifts to neutral/bearish
👉 Would signal deeper correction toward 21,000 zone
Macro Context: Growth vs Yields Tug of War
The Nasdaq’s strength has been driven by:
• AI and tech Leadership
• Strong Earnings from mega-cap stocks
• Continued investor appetite for growth
However, headwinds remain:
• Rising bond yields (pressure on tech valuations)
• Fed policy uncertainty
• Rotation into value sectors
This creates a push-pull dynamic, explaining the current consolidation phase.
Conclusion: Strong Trend, Controlled Pause — Buyers Still in Control
The Nasdaq Composite remains in a powerful uptrend, supported by rising moving averages, strong Fibonacci structure, and resilient momentum. The recent pullback is best interpreted as a healthy consolidation rather than a reversal.
As long as price holds above the 23,700–24,400 zone, the bullish structure remains intact, and the market is likely preparing for another upward leg.
👉One-Line Takeaway:
Nasdaq is consolidating after a strong breakout, holding above key Fibonacci and EMA supports — a continuation higher remains the dominant outlook unless 22,500 breaks.


 Please wait processing your request...