
Key Highlights
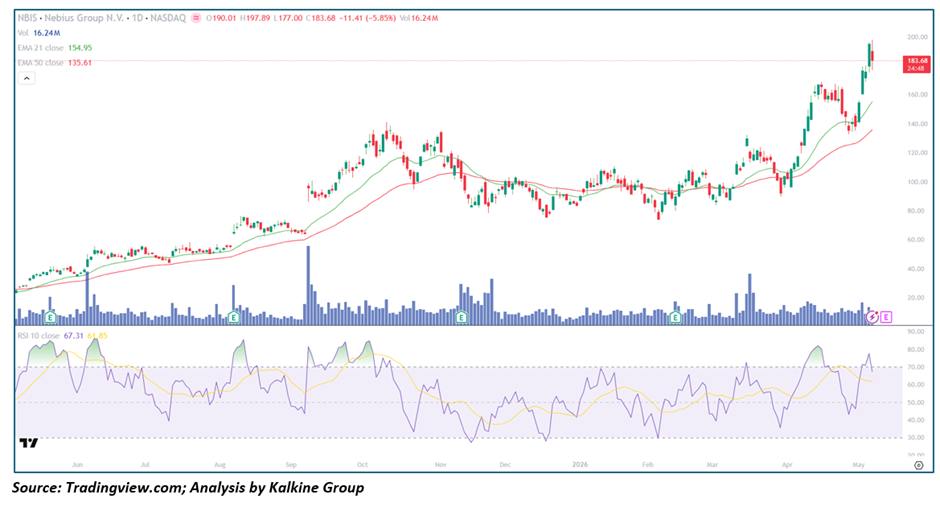
- Nebius Group (Nasdaq: NBIS) is pulling back -5.85% to $183.68 after hitting an all-time high near $197.89, following a near-parabolic rally from the $130s in early April 2026
- Price remains significantly above both the 21-day EMA ($154.95) and 50-day EMA ($135.61), confirming the broader uptrend structure remains fully intact
- RSI-10 at 67.31 with smoothing average at 61.85 reflects a healthy momentum reset from what was a deeply overbought condition near the recent peak — constructive rather than alarming
- Volume at 16.24M is elevated on today's pullback, consistent with profit-taking after a parabolic move, though the accumulation profile across the broader trend remains bullish
- Structure shows a sustained multi-month uptrend from June 2025 lows near $25, with price appreciating nearly 700% over the period — one of the strongest trending setups on the NASDAQ
Trend Structure: Parabolic Uptrend with Near-Term Cooling
NBIS has been one of the most aggressively trending stocks on the NASDAQ over the past twelve months, with price climbing from the mid-$20s in mid-2025 to nearly $200 by May 2026. The uptrend has been characterized by a series of powerful rally legs interrupted by sharp but brief corrective phases — each of which found support at or near the rising EMA-21 before launching the next leg higher. The most recent rally leg, which accelerated from the $130 zone in March–April 2026 to the $197 high, was the steepest and most compressed of the entire trend, reflecting increasing momentum and likely speculative participation. Today's -5.85% pullback is the natural consequence of such an extended move and does not represent structural deterioration of any kind.
Price Action: Healthy Digestion After All-Time High
Price action over the past several weeks tells a compelling story of momentum exhaustion at the highs followed by a controlled unwind. NBIS tagged an all-time high near $197.89 this session before retreating to close around $183.68 — a significant intraday Reversal that suggests near-term Supply is present at the $195–$200 zone. However, the broader context is important: the stock has essentially doubled from its April 2026 lows in under six weeks, making some digestion not only expected but necessary for the trend to remain sustainable. Prior corrective phases in this trend — notably in September–November 2025 and again in December 2025–January 2026 — saw drawdowns of 30–40% before buyers re-engaged aggressively. The current pullback, if it follows a similar pattern, would find meaningful support well above the EMA-21 at $154.95.
Moving Averages: Steep Bullish Alignment, Wide Gap Warrants Monitoring
The Moving Average configuration for NBIS remains unambiguously bullish — price at $183.68 sits approximately $29 above the EMA-21 ($154.95) and $48 above the EMA-50 ($135.61), both of which are trending steeply higher. This wide gap between price and the moving averages reflects the parabolic nature of the recent rally and suggests that some mean reversion toward the EMAs is possible and healthy before the next leg higher. A pullback toward the $155–$160 EMA-21 zone would be entirely consistent with prior corrective behavior in this trend and would represent a high-quality re-entry opportunity within the broader bullish structure. Both EMAs are rising sharply, confirming sustained trend momentum at the structural level.
Momentum Indicators: Constructive Reset from Overbought
RSI-10 at 67.31, with its smoothing average at 61.85, has come off what was likely an 80+ overbought reading at the recent peak and is now normalizing into healthier mid-to-upper range territory. Notably, the RSI line is still above its smoothing average — suggesting momentum, while cooling, has not yet turned negative. This is a constructive setup: the momentum reset is creating room for a fresh rally leg without the immediate risk of a prolonged RSI-driven sell-off. Throughout the broader trend, RSI dips toward the 40–50 zone have consistently marked optimal re-entry points, and the current reading of 67 suggests the market is still far from that level.
Volume Analysis: Profit-Taking on Elevated Volume, Trend Accumulation Intact
Volume at 16.24M is elevated relative to recent average sessions, consistent with active profit-taking following the all-time high print. However, the broader volume profile across the twelve-month trend is constructive — notable accumulation spikes occurred at the July 2025, October 2025, and February–March 2026 Earnings events, each of which preceded a sustained move higher. The current elevated volume on a down session is characteristic of a post-parabolic shakeout rather than systematic distribution, particularly given that price remains well above all key moving average support levels.
Key Technical Levels and Scenarios
Support Levels
- $177–$180 — Intraday low and near-term session support
- $160–$165 — Short-term consolidation support zone
- $154.95 — EMA-21; critical medium-term support on any extended pullback
Resistance Levels
- $190–$197.89 — Recent all-time high zone; immediate overhead resistance
- $200 — Psychological resistance and next major upside target
- $220+ — Extended bullish target on continuation
Scenarios
- Bullish Continuation (Primary Case) — Price consolidates between $175 and $195 over the next one to two weeks, RSI resets toward 60, and NBIS resumes its advance through $200 on renewed volume expansion.
- Deeper Consolidation (Secondary Case) — Price pulls back toward the $155–$165 EMA-21 zone, builds a fresh base, and then launches the next leg higher — a healthy outcome that would mirror prior corrective phases in this trend.
- Extended Correction (Low Probability) — A broader Market Risk-off environment or company-specific negative development triggers a Retracement toward the EMA-50 near $135; historically, this zone has attracted aggressive buying interest and would not negate the primary uptrend.
Conclusion: Post-Parabolic Reset Within One of NASDAQ's Strongest Uptrends
Nebius Group remains one of the most compelling trending setups on the NASDAQ, with a near-700% appreciation from its mid-2025 lows underpinned by consistent accumulation, bullish EMA alignment, and strong momentum throughout. Today's -5.85% pullback from all-time highs is entirely consistent with the corrective behavior seen at every prior peak in this trend and should be viewed as a healthy reset rather than a reversal signal. As long as NBIS holds above the $154.95 EMA-21 support on any further weakness, the broader uptrend remains firmly intact with scope for continuation toward $200 and well beyond. Volume re-expansion above $190 on the next rally attempt would serve as the key confirming signal for the next leg higher.


 Please wait processing your request...