
Image source: Shutterstock
Highlights
- Newmont flipped its net income from a loss of USD 2,494.0 million in FY23 to a profit of USD 3,348.0 million in FY24
- Cash from operating activities increased by 130.3% YoY, totalling USD 6,363.0 million in FY24
- The company reduced debt by USD 1.4 billion and achieved a net debt to adjusted EBITDA ratio of 0.6x
- In March 2025, Newmont completed the sale of Musselwhite, Éléonore, and CC&V operations, generating USD 1.7 billion in after-tax proceeds
- In FY25, Newmont plans sustaining capital expenditures of USD 1.8bn and development capital spending of USD 1.3bn to support key projects within the Tier 1 Portfolio.
Newmont Corporation (NYSE:NEM) is a gold producer with assets and operations in various countries, including Argentina, Chile, Ghana, Peru, Suriname, Papua New Guinea, Fiji, Mexico, the Dominican Republic, Ecuador, Canada, the United States, and Australia.
For the financial year 2024 (FY24), the company reported a notable increase in total revenue, reaching USD 18,682.0 million, compared to USD 11,812.0 million in FY23, marking a growth of 58.2%. This growth was primarily driven by higher revenue from the management and advisory fee segment, alongside increased realized investment gains stemming from strategic portfolio allocations.
Additionally, net income saw a significant turnaround, moving from a loss of USD 2,494.0 million in FY23 to a profit of USD 3,348.0 million in FY24. This improvement was largely due to the revenue boost, although higher operating expenses and an increased income tax expense partially offset it.
The company also demonstrated decent cash flow performance for the year. Cash from operating activities (YTD) rose by 130.3% YoY, totalling USD 6,363.0 million in FY24, up from USD 2,763.0 million in FY23. This increase was attributed to higher net income, although an unfavourable change in working capital partially impacted it.
Meanwhile, cash and cash equivalents stood at USD 3,619.0 million at the end of FY24, reflecting a 20.6% increase from USD 3,002.0 million in FY23. This rise was primarily due to cash inflows from operating activities, which were somewhat offset by outflows from investing and financing activities.
Over the past year, NEM reduced debt by USD 1.4 billion. It achieved a net debt to adjusted EBITDA ratio of 0.6x. In addition, the company’s free cash flow surged to USD 2.9 billion in 2024, including a Q4 record of USD 1.6 billion, up 3214% from USD 88 million in 2023.
Recent Business Update
In March 2025, Newmont Corporation announced completing the sale of its Musselwhite, Éléonore, and Cripple Creek & Victor (CC&V) operations, generating USD 1.7 billion in after-tax cash proceeds. This move is part of the company’s strategic portfolio optimization initiated in early 2024, aimed at strengthening its investment-grade balance sheet and supporting ongoing share repurchases.
Additionally, Newmont expects to close the sales of its Akyem and Porcupine operations in the first half of 2025, potentially adding up to USD 0.8 billion in after-tax proceeds, bringing total gross proceeds from the divestiture program to up to USD 4.3 billion.
Company Outlook
Newmont Corporation projects attributable gold production of 5.9 Moz in 2025, with 5.6 Moz coming from its Total Tier 1 Portfolio and 0.3 Moz from non-core assets held for sale in Q1. The company anticipates a Gold All-In Sustaining Cost (AISC) of USD 1,630 per ounce for the Total Portfolio and USD 1,620 per ounce for the Tier 1 Portfolio. Additionally, Newmont plans sustaining capital expenditures of USD 1.8 billion and development capital spend of USD 1.3 billion to support key projects within the Tier 1 Portfolio.
Stock Information
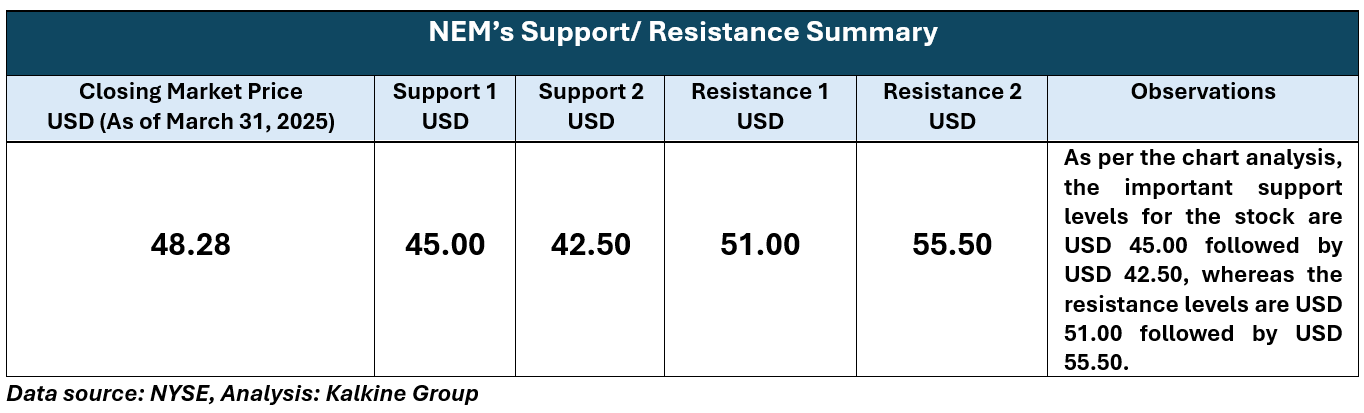
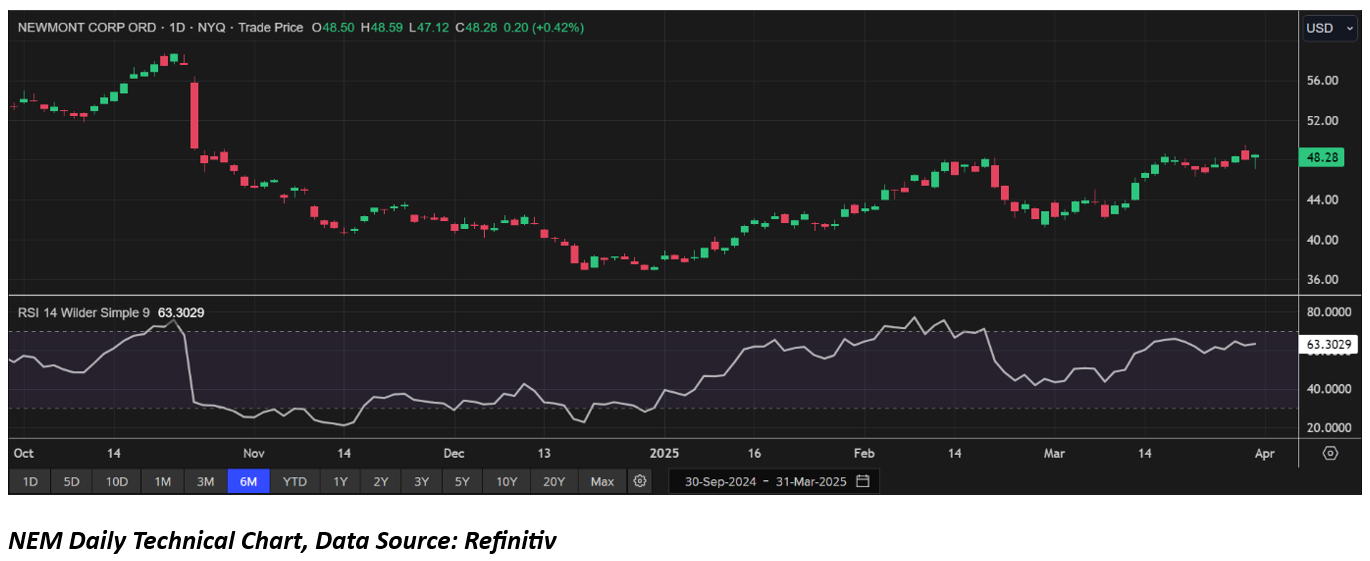
NEM's share price has delivered a return of 30.48% over the past three months. In the long term, the stock has shown a growth of 34.70% over the last year. As of March 31, 2025, the stock is trading near the higher end of its 52-week range, which spans from USD 58.72 to USD 36.10, with a closing price of USD 48.28.
Note 1: Past performance is not a reliable indicator of future performance.
Note 2: The reference data for all price data, currency, technical indicators, support, and resistance levels is March 31, 2025. The reference data in this report has been partly sourced from EODHD/Others.
Technical Indicators Defined
Support: A level at which the stock prices tend to find support if they are falling, and a downtrend may take a pause backed by demand or buying interest. Support 1 refers to the nearby support level for the stock and if the price breaches the level, then Support 2 may act as the crucial support level for the stock.
Resistance: A level at which the stock prices tend to find resistance when they are rising, and an uptrend may take a pause due to profit booking or selling interest. Resistance 1 refers to the nearby resistance level for the stock and if the price surpasses the level, then Resistance 2 may act as the crucial resistance level for the stock.


 Please wait processing your request...