
Image source: Shutterstock
Highlights
- Nu Holdings’ FY24 revenue rose 43.4% YoY to USD 11,517.1 million, driven by higher interest income and financial instrument gains
- Net income jumped 91.4% YoY to USD 1,972.1 million, reflecting a decent top-line growth despite higher expenses
- Net operating cash inflows grew 89.5% YoY to USD 2,399.0 million, supported by increased profitability
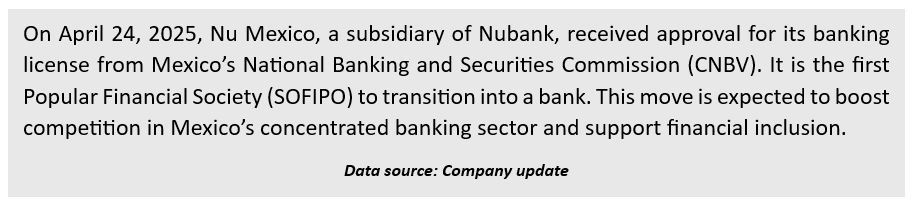
- The company received a banking license in April 2025, becoming the first SOFIPO to transition into a bank
Nu Holdings Ltd (NYSE:NU) is a holding company based in Brazil. It provides digital banking services to its customers. The company offers products across five financial areas: spending, saving, investing, borrowing, and protecting.
For the financial year 2024 (FY24), NU’s revenue grew by 43.4% yoy to USD 11,517.1 million, driven by higher interest income and gains (losses) on financial instruments. Net income surged 91.4% yoy to USD 1,972.1 million in FY24, reflecting the revenue increase, though partially offset by higher costs and expenses.
Net operating cash inflows rose by 89.5% yoy to USD 2,399.0 million in FY24, supported by the higher net income, despite a negative impact from changes in net working capital. Total cash and cash equivalents increased by 55.1% yoy to USD 9,185.7 million, due to cash inflows from operations and financing, partly offset by outflows from investing activities.
Recent Business Update
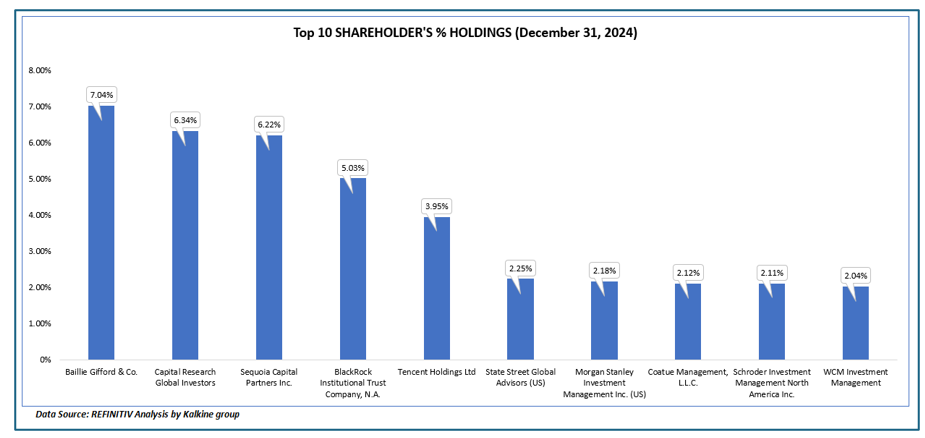
Top 10 Shareholders
The top 10 shareholders of NU collectively own approximately 39.28% of the company. This indicates a relatively concentrated ownership structure. Baillie Gifford & Co. is the largest shareholder, holding a 7.04% stake. Capital Research Global Investors follows closely with a 6.34% stake.
Stock Information
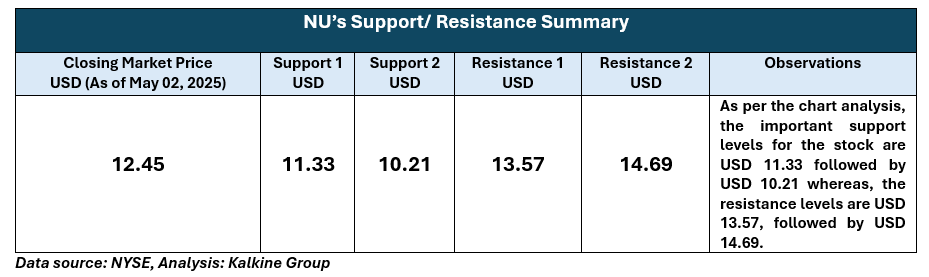
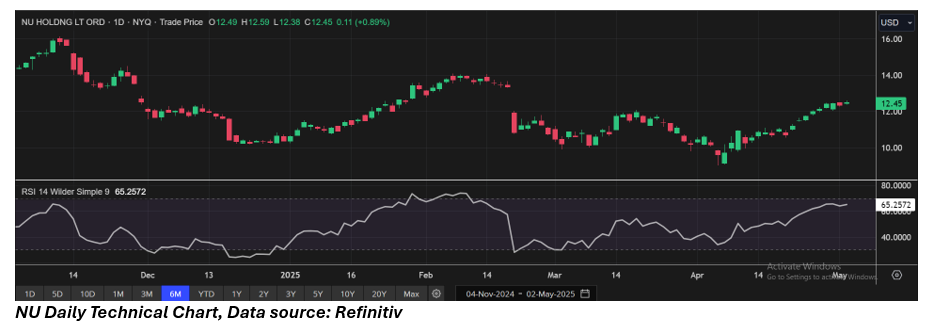
The stock has gained 12.45% in the past month, whereas it has declined by around 13.36% in the past six months. The stock is around the middle zone of its 52-week range of USD 16.14 (high) and USD 9.01 (low). Shares of NU last traded at USD 12.45 on May 02, 2025.
Note 1: Past performance is not a reliable indicator of future performance.
Note 2: The reference data for all price data, currency, technical indicators, support, and resistance levels is May 02 2025. The reference data in this report has been partly sourced from EODHD/Others.
Technical Indicators Defined
Support: A level at which the stock prices tend to find support if they are falling, and a downtrend may take a pause backed by demand or buying interest. Support 1 refers to the nearby support level for the stock and if the price breaches the level, then Support 2 may act as the crucial support level for the stock.
Resistance: A level at which the stock prices tend to find resistance when they are rising, and an uptrend may take a pause due to profit booking or selling interest. Resistance 1 refers to the nearby resistance level for the stock and if the price surpasses the level, then Resistance 2 may act as the crucial resistance level for the stock.


 Please wait processing your request...