_05_04_2026_23_58_40_477180.jpg)
Key Highlights
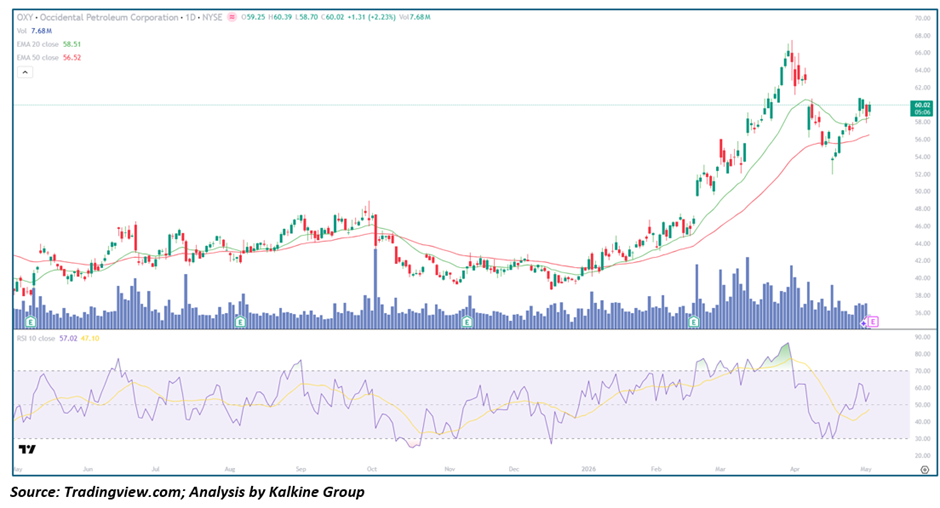
- Occidental Petroleum Corporation (NYSE: OXY) is trading near the 60 zone after a strong recovery from recent pullback
• Price is trading above the 20-day (~58.51) and 50-day (~56.52) moving averages
• RSI near ~57 indicates recovering momentum with room for upside
• Volume remains stable with periodic expansion during rallies
• Structure shows a pullback followed by trend continuation within a broader uptrend
Trend Structure: Uptrend Continuation
OXY is maintaining a bullish structure within a broader upward trend.
Key observations include:
• Formation of higher highs and higher lows
• Strong rally followed by controlled pullback
• Price stabilizing above key moving averages
This suggests:
• Buyers remain in control
• Trend remains intact
• Pullbacks are being absorbed
The structure reflects a continuation phase within an established uptrend.
Price Action: Pullback and Recovery
Recent price behavior highlights strength after correction:
- Sharp rally toward the 65–67 zone followed by pullback
• Higher low formation near 55–57 zone
• Renewed upward movement
This implies:
• Healthy correction within trend
• Strong demand at lower levels
• Buyers stepping in during dips
Such action typically signals:
• Continuation of the uptrend
• Potential move toward prior highs
Moving Averages: Bullish Alignment
The moving average setup confirms strength:
- Price above both 20-day and 50-day MAs
• 20-day MA above 50-day MA
• Both averages trending upward
Interpretation:
• Short-term trend bullish
• Medium-term trend supportive
• Pullbacks likely to attract buyers
Momentum Indicators: Recovery Phase
RSI is moving toward the 55–60 zone.
Key signals:
• Momentum recovering from lower levels
• No overbought conditions
• Positive momentum shift
Interpretation:
• Upside potential remains
• Momentum rebuilding
• No immediate exhaustion
Volume Analysis: Stable Participation
Volume trends indicate:
- Moderate activity during rallies
• No major distribution spikes
• Consistent participation
This suggests:
• Balanced buying interest
• Healthy trend continuation
• No signs of weakness
Market Structure: Pullback Within Uptrend
The broader structure reflects:
- Strong prior rally
• Controlled correction
• Resumption of upward movement
This combination suggests:
• Trend continuation likely
• Pullbacks acting as buying opportunities
• Positive market sentiment
Key Technical Levels and Scenarios
Support Levels
- 58 as immediate support
• 55 as short-term support
• 52 as major support
Resistance Levels
- 62 as immediate resistance
• 65–67 as next upside zone
• 70 as extended target
Scenarios
- Bullish Continuation (Primary Case)
• Price sustains above 58
• Momentum strengthens
• Volume supports move
• Rally toward 65–70 - Consolidation (Secondary Case)
• Price ranges between 55–62
• RSI stabilizes
• Trend remains intact - Pullback Scenario (Low Probability)
• Price drops below 55
• Retest of 52
• Buyers likely re-enter
Conclusion: Bullish Structure with Continued Upside Potential
Occidental Petroleum Corporation is showing a strong uptrend supported by bullish moving average alignment, recovering momentum, and stable volume participation. The recent pullback appears healthy, and the ongoing recovery suggests potential continuation toward higher levels. As long as key support zones hold, the broader trend remains bullish with scope for further gains.


 Please wait processing your request...