
Key Highlights
• Ondas Holdings Inc. (ONDS) is trading within a converging triangle pattern, indicating a phase of consolidation
• Price action reflects tightening range with lower highs and higher lows
• A breakout from the triangle could trigger a sharp volatility expansion
• Momentum indicators remain neutral, suggesting indecision in the near term
• Key resistance and support levels are narrowing, increasing the likelihood of a decisive move
Trend Structure: Consolidation Within a Converging Triangle
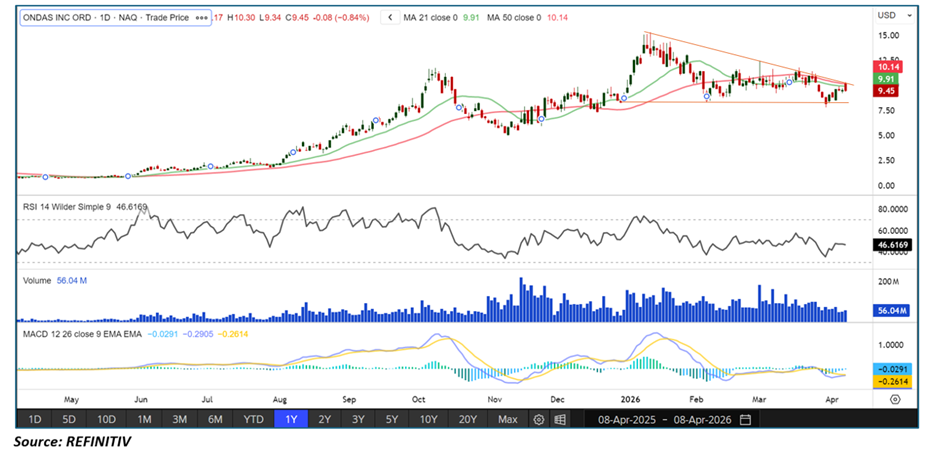
Ondas Holdings is currently exhibiting a classic converging triangle pattern, formed by a series of lower highs and higher lows. This structure typically represents a period of consolidation where buying and selling pressures are gradually balancing out.
Such patterns often emerge after a prior directional move and are considered continuation or breakout formations depending on the direction of the eventual move. In ONDS’ case, the tightening price action reflects a market in equilibrium, awaiting a catalyst for the next directional trend.
As the price approaches the apex of the triangle, the probability of a breakout increases significantly.
Price Action: Range Compression Signals Imminent Move
The defining feature of ONDS’ current price action is range compression. Each successive price swing is becoming smaller, indicating reduced volatility and participation.
Key observations:
• Lower highs indicate selling pressure at elevated levels
• Higher lows suggest buyers are stepping in earlier
• Narrowing price range reflects indecision
This compression phase typically precedes a sharp expansion in volatility. Once price breaks out of the triangle—either upward or downward—it often leads to a strong directional move supported by increased volume.
Traders usually monitor such setups closely, as breakouts from converging triangles can be swift and decisive.
Momentum Indicators: Neutral Bias with Breakout Potential
Momentum indicators such as the RSI are currently hovering around the midpoint, reflecting a neutral stance.
Key RSI insights:
• RSI near 50 indicates balance between buyers and sellers
• No clear overbought or oversold signals
• Momentum is coiling alongside price
This neutrality aligns with the consolidation phase seen in the triangle pattern. However, once a breakout occurs, RSI is likely to move sharply in the direction of the breakout, confirming momentum.
MACD Analysis: Flattening Momentum Reflects Indecision
The MACD indicator is also reflecting the ongoing consolidation, with lines moving closer together and the histogram flattening.
- MACD lines are converging
• Histogram shows reduced momentum
• No strong directional bias currently
This setup is typical during consolidation phases. A bullish or bearish crossover post-breakout would provide additional confirmation of the next trend direction.
olume Analysis: Declining Activity Ahead of Breakout
Volume levels have generally declined as the triangle pattern has developed. This is a common characteristic of consolidation patterns.
- Reduced volume during range compression
• Indicates lack of strong conviction from either side
• Breakout likely to be accompanied by a volume spike
A surge in volume during the breakout phase would be a critical confirmation signal, validating the strength of the move.
Market Structure: Volatility Expansion Expected
The current market structure strongly suggests that ONDS is nearing a volatility expansion phase. As the triangle narrows:
- Price is forced into a tighter range
• Breakout pressure builds
• A sharp move becomes increasingly likely
This expansion phase can occur in either direction, making it essential to monitor key breakout levels rather than pre-empting direction.
Key Technical Scenarios
- Bullish Breakout (Upside Scenario)
• Price breaks above upper trendline
• Volume expands significantly
• RSI moves above 60
• Momentum accelerates toward higher resistance levels - Bearish Breakdown (Downside Scenario)
• Price breaks below lower trendline
• Increased selling pressure emerges
• RSI drops below 40
• Downtrend resumes or extends - Continued Consolidation (Short-Term Scenario)
• Price remains within triangle
• Range continues to tighten
• Breakout delayed but pressure builds
Risk Considerations
- False breakouts are common in triangle patterns
• Lack of volume confirmation may weaken breakout reliability
• Broader market sentiment could influence breakout direction
• Delayed breakout may lead to prolonged consolidation
Conclusion: Triangle Formation Points to Imminent Breakout Move
Ondas Holdings is currently in a consolidation phase within a converging triangle, a pattern that typically precedes a significant move. The tightening price action, combined with neutral momentum indicators, suggests that the stock is building energy for a breakout.
While the direction of the move remains uncertain, a decisive break accompanied by strong volume will likely determine the next trend. Traders should closely monitor key support and resistance levels, as a breakout from this structure could lead to heightened volatility and a sharp directional move in the near term.


 Please wait processing your request...