_06_24_2024_04_34_29_964001.jpg)
Image source: Shutterstock
Highlights
- In Q1FY24, CME’s total revenue increased by 3.21% due to higher revenues across all segments.
- Net income declined by approximately 3.24%, primarily due to reduced investment income, despite the offsetting effect of increased total revenue.
- On 28 May 2024, the company marked a record volume of 34, 350, 339 contracts traded in its US treasury complex, greater than the previous record set on Nov 27, 2023.
CME Group Inc. (NASDAQ: CME) offers a wide range of products spanning all asset classes, including options, futures, cash instruments, and over-the-counter (OTC) products. It has a market capitalization of USD 70.76 billion.
In the first quarter of fiscal year 2024, the company achieved total revenues of USD 1,487.9 million, marking a 3.21% increase compared to pcp. This growth was driven by higher revenues across all segments, including clearing and transaction fees, as well as market data and information services. However, net income declined by approximately -3.24%, primarily attributed to reduced investment income, despite the offsetting effect of increased total revenue.
CME Group has shown robust financial growth, achieving a compound annual growth rate (CAGR) of approximately 20.3% from 2018 to 2023, with revenues rising from USD 4.3 billion to USD 10.9 billion over this period. In Q1FY24, CME reported an impressive return on equity (ROE) of 33.4%, surpassing the industry median of 21.9%. Furthermore, the company maintains a strong financial position, reflected in a low debt/equity ratio of 0.13, well below the industry median of 0.57.
Recent business update
The company has scheduled to announce its earnings for 2Q 2024 prior to the market opening on 24 July 2024. On 28 May 2024, the company marked a record volume of 34, 350, 339 contracts traded in its US treasury complex, greater than the previous record set on Nov 27, 2023.
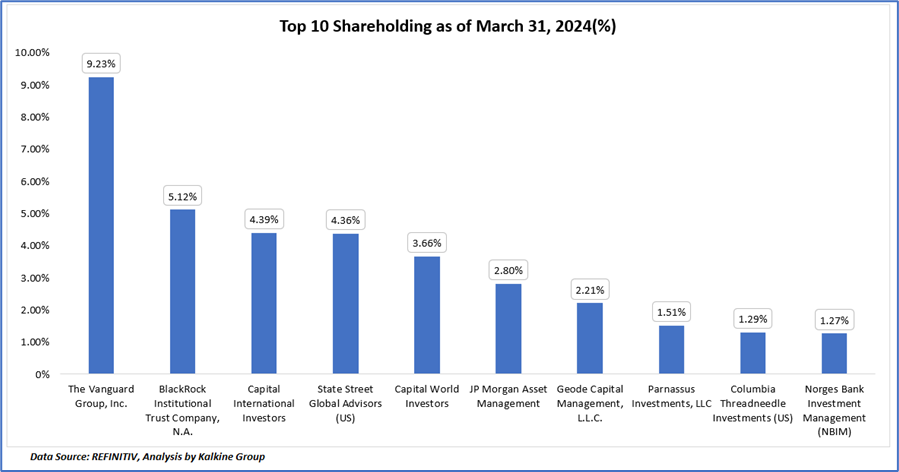
Top 10 shareholders
The top 10 shareholders of CME collectively hold approximately 35.85% of the total shares. The Vanguard Group, Inc. and BlackRock Institutional Trust Company, N.A. are the largest shareholders, with stakes of approximately 9.23% and 5.12% in the company, respectively.
Stock performance
The stock price of CME has dropped by 5.39% over the last six months and by 2.43% over the past nine months. Currently, it is approaching the lower end of its 52-week trading range, which spans from a high of USD 223.80 to a low of USD 177.97.
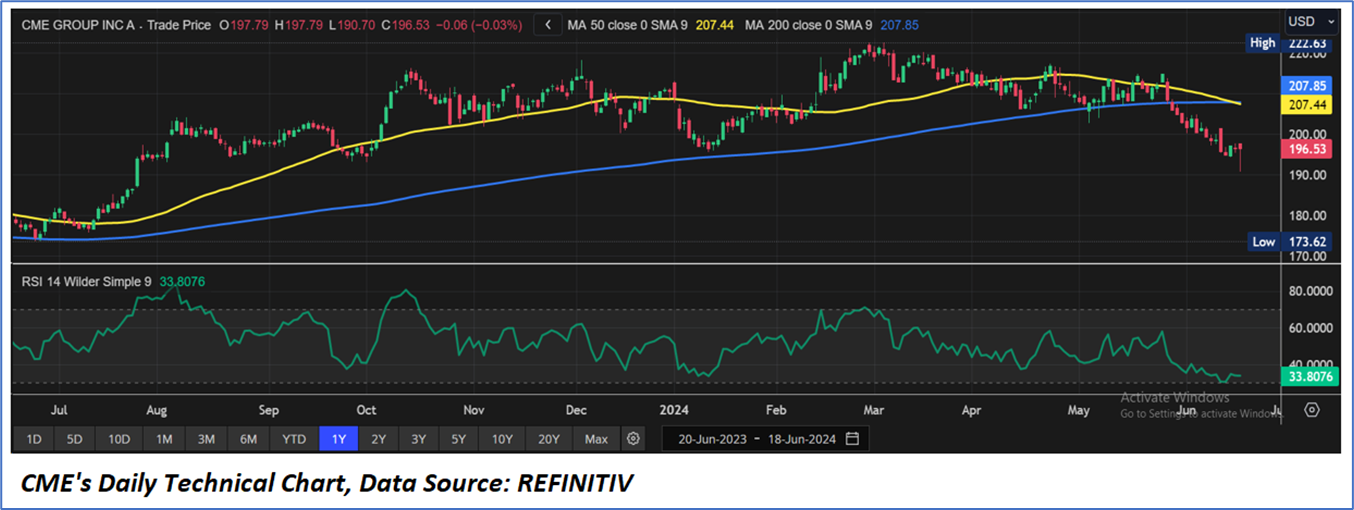
Note 1: Past performance is not a reliable indicator of future performance.
Note 2: The reference date for all price data, currency, technical indicators, support, and resistance levels is June 18, 2024. The reference data in this report has been partly sourced from EODHD/Others.


 Please wait processing your request...