
Image source: Shutterstock
Highlights
- Par Pacific Holdings’ FY24 revenue decreased by 3.13% YoY to USD 7.97 billion, primarily due to lower commodity prices
- The company posted a net loss of USD 33.32 million in FY24, a sharp decline from the previous year’s profit of USD 728.64 million
- Retail adjusted EBITDA reached a record high of USD 76.0 million in FY24, marking an 11.3% increase year-over-year
- The company repurchased 5 million shares in 2024, reducing the total shares outstanding by 9% and enhancing shareholder value
Par Pacific Holdings, Inc. (NYSE:PARR) is an energy company supplying both renewable and conventional fuels to the western U.S. It operates 125,000 barrels per day of refining capacity across three locations and a comprehensive energy infrastructure network, including storage, marine, rail, and pipeline assets.
In the financial year 2024 (FY24), PARR’s total revenue decreased by 3.13% to USD 7,974.46 million from USD 8,231.95 million in FY23, primarily due to lower prices of underlying commodities. Net income turned negative to a loss of USD 33.32 million from a profit of USD 728.64 million in FY23, driven by higher operating expenses and reduced revenue.
In FY24, operating cash flows saw a significant decline of 85.53% to USD 83.78 million from USD 579.16 million, mainly due to decreased net income and unfavourable changes in working capital. Cash and cash equivalents also decreased by 31.24%, from USD 279.11 million to USD 191.92 million, impacted by cash outflows from investing and financing activities, partially offset by operating cash inflows.
On a positive note, retail adjusted EBITDA set a record of USD 76.0 million in 2024, marking an 11.3% increase from USD 68.3 million in 2023.
Additionally, in 2024, PARR repurchased 5 million shares, representing 9% of the total shares outstanding at year-end, thereby enhancing shareholder value.
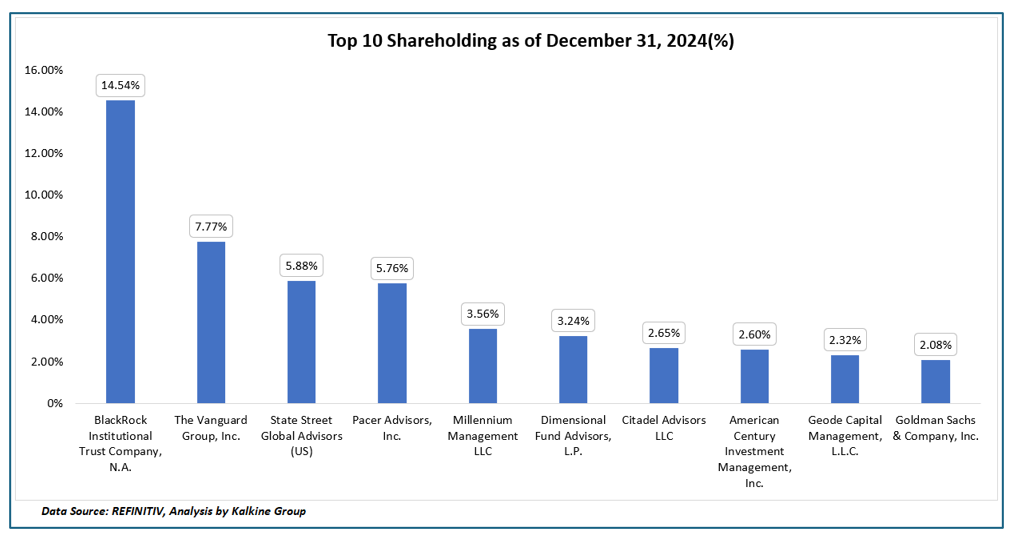
Top 10 Shareholders
The top 10 shareholders of PARR collectively hold approximately 50.39% of the total shares, indicating a concentrated ownership structure. The largest stakeholders are BlackRock Institutional Trust Company, N.A., with a 14.54% stake, and The Vanguard Group, Inc., owning around 7.77% of the company.
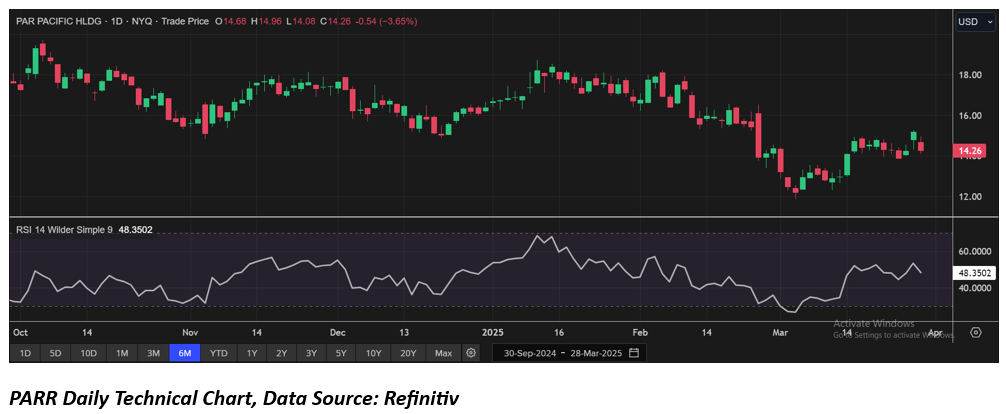
Stock Information
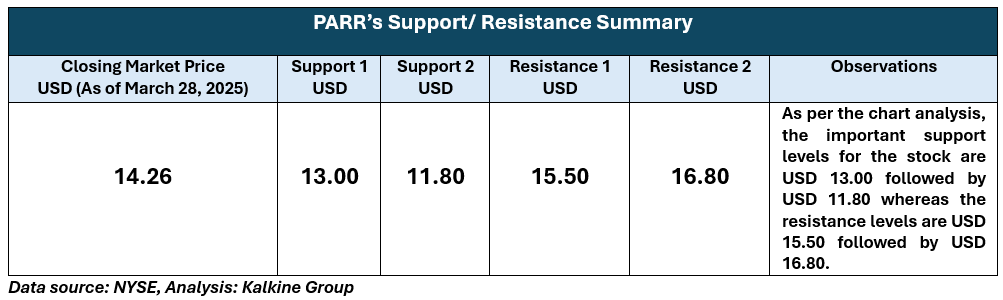
The stock has declined 11.92% over the last three months and 43.52% in the past nine months. It is trending toward the lower end of its 52-week range, which spans from a high of USD 40.20 to a low of USD 11.86. As of March 28, 2025, the stock closed at USD 14.26.
Note 1: Past performance is not a reliable indicator of future performance.
Note 2: The reference data for all price data, currency, technical indicators, support, and resistance levels is March 28, 2025. The reference data in this report has been partly sourced from EODHD/Others.
Technical Indicators Defined
Support: A level at which the stock prices tend to find support if they are falling, and a downtrend may take a pause backed by demand or buying interest. Support 1 refers to the nearby support level for the stock and if the price breaches the level, then Support 2 may act as the crucial support level for the stock.
Resistance: A level at which the stock prices tend to find resistance when they are rising, and an uptrend may take a pause due to profit booking or selling interest. Resistance 1 refers to the nearby resistance level for the stock and if the price surpasses the level, then Resistance 2 may act as the crucial resistance level for the stock.


 Please wait processing your request...