
Key Highlights
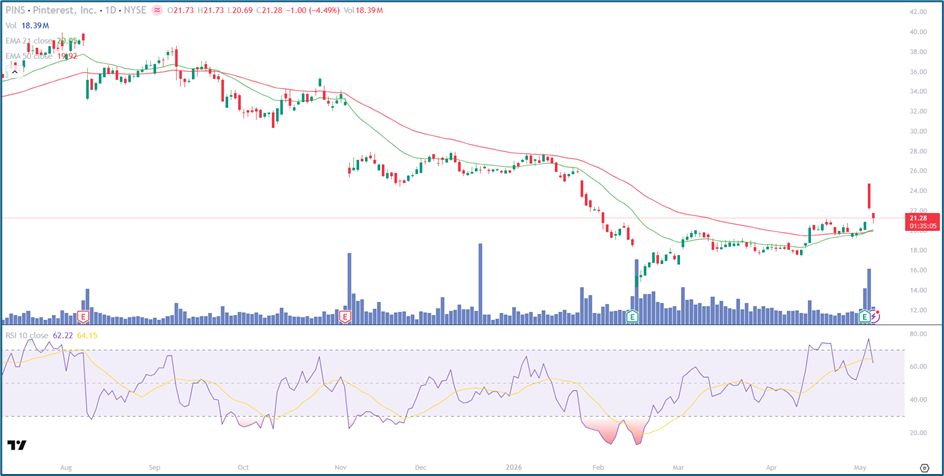
- Pinterest, Inc. (NYSE: PINS) is trading near $21.28, down -4.49% on heavy Volume (~18.39M), following an Earnings-driven reaction
• Price is holding just above the 21-day EMA (~$20.95) and 50-day EMA (~$19.92), with the gap narrowing sharply after today’s decline
• RSI-10 at 62.22, with smoothing near 64.15, reflects still-constructive momentum despite the pullback
• Volume spike marks one of the highest in recent months, indicating strong institutional activity
• Structure shows a recovery from February lows now facing a critical near-term test
Source: Tradingview.com; Analysis by Kalkine Group
Trend Structure: Recovery Faces Near-Term Disruption
PINS is at a key inflection point as an earnings-driven selloff challenges its ongoing recovery.
Key observations include:
• A prolonged downtrend from ~$38 (Aug 2025) to ~$17–$18 (Feb 2026), a ~53% decline
• A steady recovery through March–April, reclaiming the $19–$22 range
• Current session sharply interrupting upward momentum
This suggests:
• The broader recovery trend remains intact but weakened
• Bulls are being tested at critical support levels
• The $20–$21 zone becomes the immediate battleground
The structure remains transitional, with recovery still valid but under pressure.
Price Action: Earnings Selloff Reverses Momentum
Recent price behavior reflects a sharp shift in sentiment:
- Intraday move from $21.73 high to $20.69 low, closing near lows
• Strong bearish intraday structure with sustained selling pressure
• Prior pattern of higher lows disrupted by today’s move
This implies:
• $21–$22 is reverting into resistance after failed breakout
• $20–$21 is critical support that must hold
• Breakdown could trigger retest of $19–$20 zone
Moving Averages: Bullish Setup Under Pressure
The Moving Average structure remains constructive but fragile:
- Price is marginally above EMA-21 (~$20.95) and EMA-50 (~$19.92)
• EMA-21 remains above EMA-50 (early golden cross structure)
• Today’s decline compresses the distance between price and averages
Interpretation:
• Bullish alignment still intact but weakening
• A close below $20.95 (EMA-21) would signal early weakness
• Break below $19.92 (EMA-50) would damage recovery structure
Momentum Indicators: Elevated but Cooling
RSI-10 at 62.22, smoothing at 64.15
Key signals:
• Momentum remains above 60, reflecting prior recovery strength
• RSI trending lower indicates cooling after recent highs
• No deep bearish signal yet, but short-term momentum is weakening
Interpretation:
• Medium-term momentum remains constructive
• Short-term bias turning cautious post-earnings
• RSI holding above 50 is key for recovery continuation
Volume Analysis: High-Impact Institutional Activity
Volume at ~18.39M signals a major event-driven session:
- One of the highest volume spikes in recent months
• Comparable to prior earnings-driven moves
• Heavy volume on a down day indicates strong selling pressure
This indicates:
• Institutional repositioning is underway
• Session carries higher significance than normal pullbacks
• Follow-through volume behavior will define next trend direction
Market Structure: Base Still Intact but Under Stress
The broader structure remains a developing recovery:
- February lows ($17–$18) remain the structural base
• Recovery formed higher lows through March–April
• Current selloff tests the integrity of that base
This suggests:
• Structure remains intact above $19–$20
• Current move is a setback, not yet a breakdown
• Next few sessions are critical for direction
Key Technical Levels and Scenarios
Support Levels
• $20.95 as immediate support (EMA-21)
• $19.92 as next support (EMA-50)
• $17–$18 as major base support
Resistance Levels
• $22–$23 as immediate resistance
• $25–$26 as next upside zone
• $28–$30 as extended resistance
Scenarios
- Bullish Recovery Continuation (Primary Case)
• Price holds above $20.95
• RSI stabilizes above 55
• Volume normalizes after selloff
• Recovery resumes toward $23–$25 - Consolidation (Secondary Case)
• Price ranges between $20 and $23
• RSI holds between 50–60
• EMAs continue gradual upward trend
• Market digests earnings reaction - Renewed Decline (Elevated Risk Case)
• Break below $20.95 and $19.92 on strong volume
• Momentum weakens further
• Retest of $18–$19 zone
Conclusion: Earnings Shock Tests Recovery, Support Critical
Pinterest is undergoing a significant post-earnings reset, with today’s sharp decline disrupting a constructive recovery trend. While the broader base remains intact above $19–$20 and moving averages still support a bullish structure, the magnitude of the selloff and elevated volume introduce near-term uncertainty. The $20.95 EMA-21 level now serves as a critical support pivot — holding above it would support a recovery continuation, while a breakdown could shift momentum back toward a bearish bias.


 Please wait processing your request...